29
/
en
AIzaSyAYiBZKx7MnpbEhh9jyipgxe19OcubqV5w
April 1, 2024
177722
Lesotho
LSO
true
2
1
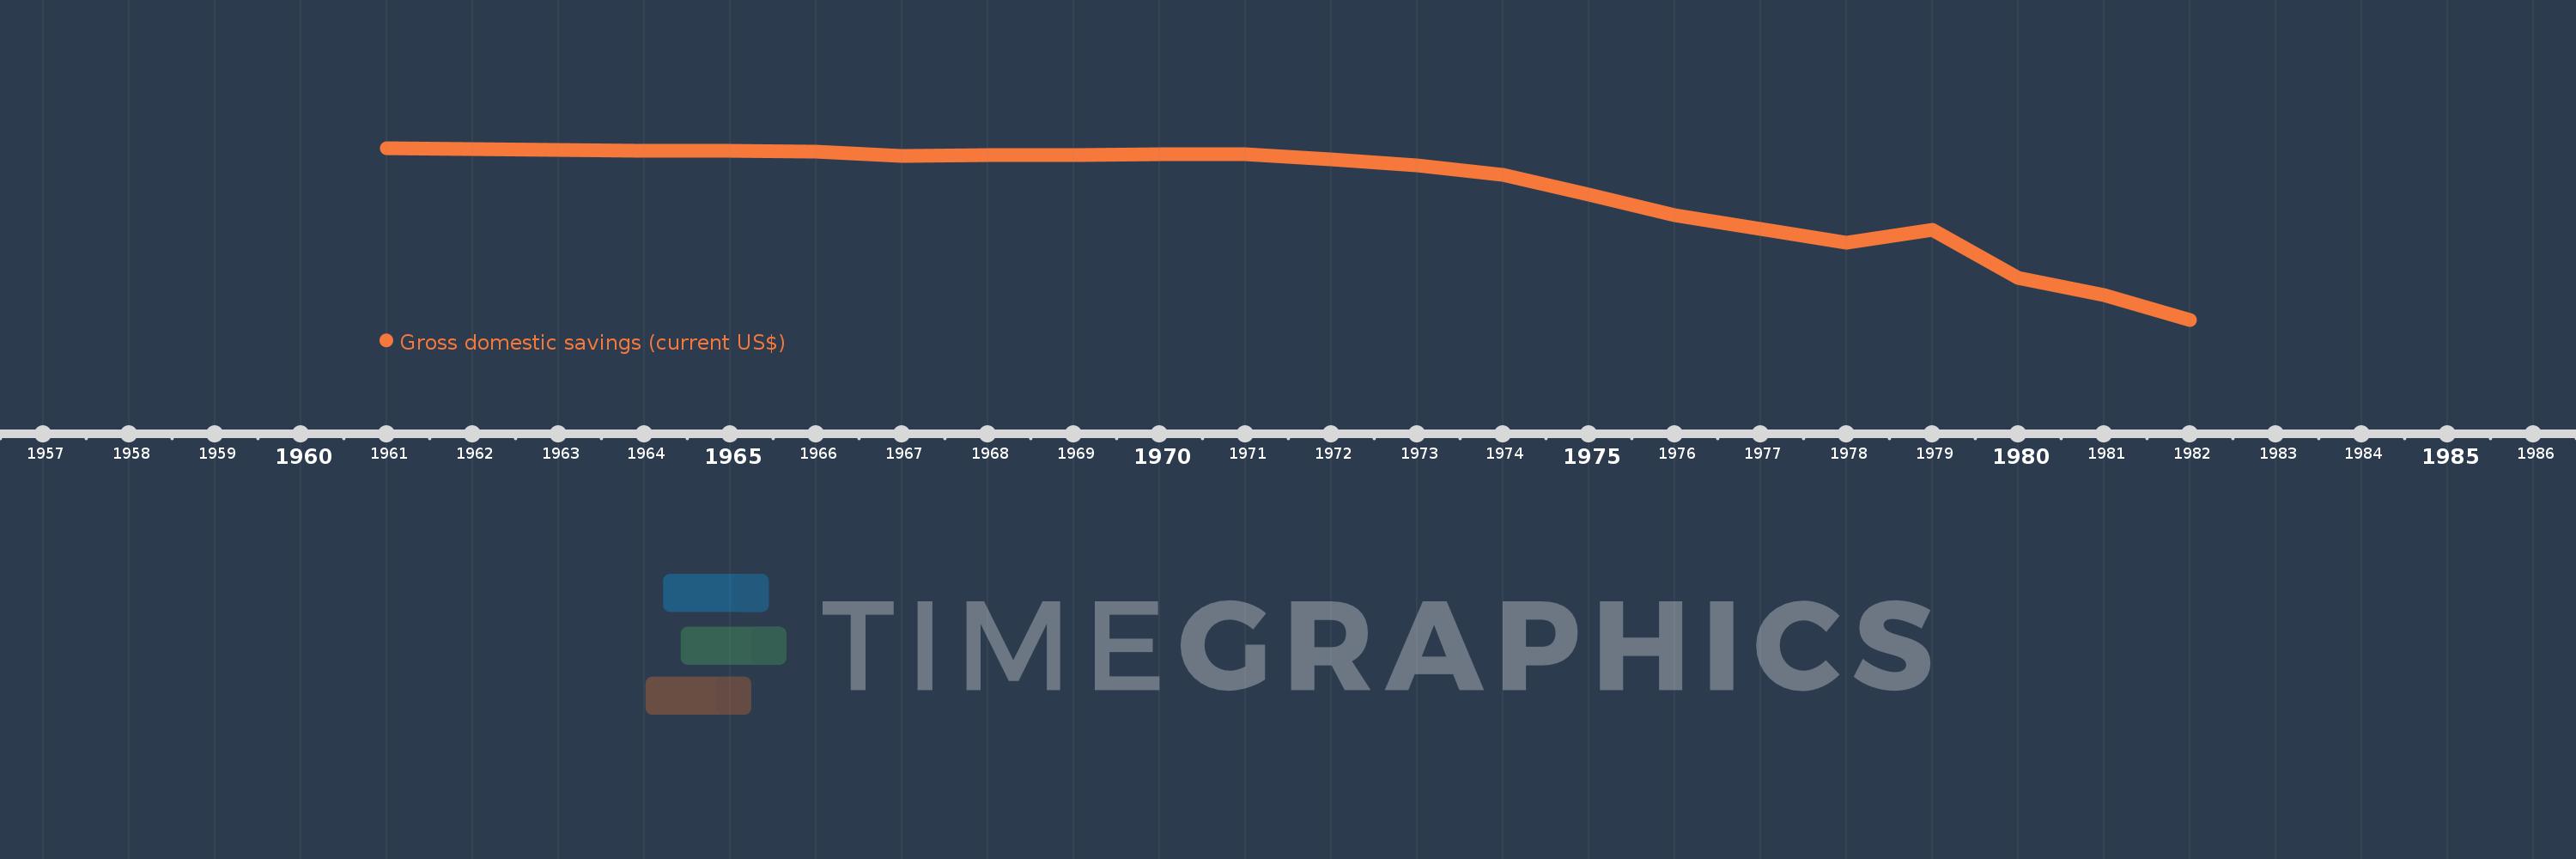
Gross domestic savings (current US$)
1982,1981,1980,1979,1978,1977,1976,1975,1974,1973,1972,1971,1970,1969,1968,1967,1966,1965,1964,1963,1962,1961
This statistics in other country:
AfghanistanAlbaniaAlgeriaAngolaAntigua and BarbudaArab WorldArgentinaArmeniaArubaAustraliaAustriaAzerbaijanBahamas, TheBahrainBangladeshBarbadosBelarusBelgiumBelizeBeninBermudaBhutanBoliviaBosnia and HerzegovinaBotswanaBrazilBrunei DarussalamBulgariaBurkina FasoBurundiCabo VerdeCambodiaCameroonCanadaCaribbean small statesCentral African RepublicCentral Europe and the BalticsChadChileChinaColombiaComorosCongo, Dem. Rep.Congo, Rep.Costa RicaCote d'IvoireCroatiaCubaCyprusCzech RepublicDenmarkDjiboutiDominicaDominican RepublicEarly-demographic dividendEast Asia & PacificEast Asia & Pacific (excluding high income)East Asia & Pacific (IDA & IBRD countries)EcuadorEgypt, Arab Rep.El SalvadorEquatorial GuineaEritreaEstoniaEthiopiaEuro areaEurope & Central AsiaEurope & Central Asia (excluding high income)Europe & Central Asia (IDA & IBRD countries)European UnionFaroe IslandsFijiFinlandFragile and conflict affected situationsFranceGabonGambia, TheGeorgiaGermanyGhanaGreeceGrenadaGuatemalaGuineaGuinea-BissauGuyanaHaitiHeavily indebted poor countries (HIPC)High incomeHondurasHong Kong SAR, ChinaHungaryIBRD onlyIcelandIDA & IBRD totalIDA blendIDA onlyIDA totalIndiaIndonesiaIran, Islamic Rep.IraqIrelandIsraelItalyJamaicaJapanJordanKazakhstanKenyaKiribatiKorea, Rep.KosovoKuwaitKyrgyz RepublicLao PDRLate-demographic dividendLatin America & Caribbean Latin America & Caribbean (excluding high income)Latin America & the Caribbean (IDA & IBRD countries)LatviaLeast developed countries: UN classificationLebanonLesothoLiberiaLibyaLithuaniaLow & middle incomeLow incomeLower middle incomeLuxembourgMacao SAR, ChinaMacedonia, FYRMadagascarMalawiMalaysiaMaldivesMaliMaltaMauritaniaMauritiusMexicoMicronesia, Fed. Sts.Middle East & North AfricaMiddle East & North Africa (excluding high income)Middle East & North Africa (IDA & IBRD countries)Middle incomeMoldovaMongoliaMontenegroMoroccoMozambiqueNamibiaNepalNetherlandsNew CaledoniaNew ZealandNicaraguaNigerNigeriaNorth AmericaNorwayOECD membersOmanOther small statesPakistanPanamaPapua New GuineaParaguayPeruPhilippinesPolandPortugalPost-demographic dividendPre-demographic dividendPuerto RicoQatarRomaniaRussian FederationRwandaSaudi ArabiaSenegalSerbiaSeychellesSierra LeoneSingaporeSlovak RepublicSloveniaSmall statesSolomon IslandsSouth AfricaSouth AsiaSouth Asia (IDA & IBRD)South SudanSpainSri LankaSt. Kitts and NevisSt. LuciaSt. Vincent and the GrenadinesSub-Saharan Africa Sub-Saharan Africa (excluding high income)Sub-Saharan Africa (IDA & IBRD countries)SudanSurinameSwazilandSwedenSwitzerlandSyrian Arab RepublicTajikistanTanzaniaThailandTimor-LesteTogoTongaTrinidad and TobagoTunisiaTurkeyTurkmenistanUgandaUkraineUnited Arab EmiratesUnited KingdomUnited StatesUpper middle incomeUruguayUzbekistanVanuatuVenezuela, RBVietnamWest Bank and GazaWorldYemen, Rep.ZambiaZimbabwe Timeline:
This timeline shows a graph from 1961 to 1982 of Lesotho. No data until 1960. Number of actual observations by date: 22.
Source name:
World Development Indicators
Source organization:
World Bank national accounts data, and OECD National Accounts data files.
Categories, topics:
Economy & Growth
Last updated:
apr 23, 2017
Indicators value changes by year
Minimum:
-261.023 mln
jan 1, 1982
Maximum:
-8.54 mln
jan 1, 1961
At the date of observation
Value
Absolute change
Change from previous value
jan 1, 1961
-8.54 mln
-8.54 mln
0.0%
jan 1, 1962
-10.36 mln
-1.82 mln
21.31%
jan 1, 1963
-11.06 mln
-699.986K
6.76%
jan 1, 1964
-12.88 mln
-1.82 mln
16.46%
jan 1, 1965
-12.74 mln
+139.997K
-1.09%
jan 1, 1966
-14.42 mln
-1.68 mln
13.19%
jan 1, 1967
-20.16 mln
-5.74 mln
39.81%
jan 1, 1968
-19.6 mln
+559.989K
-2.78%
jan 1, 1969
-18.9 mln
+699.986K
-3.57%
jan 1, 1970
-17.36 mln
+1.54 mln
-8.15%
jan 1, 1971
-18.2 mln
-839.983K
4.84%
jan 1, 1972
-25.168 mln
-6.968 mln
38.29%
jan 1, 1973
-33.823 mln
-8.656 mln
34.39%
jan 1, 1974
-47.55 mln
-13.727 mln
40.58%
jan 1, 1975
-76.527 mln
-28.976 mln
60.94%
jan 1, 1976
-106.829 mln
-30.302 mln
39.6%
jan 1, 1977
-127.645 mln
-20.816 mln
19.49%
jan 1, 1978
-148.344 mln
-20.699 mln
16.22%
jan 1, 1979
-128.795 mln
+19.549 mln
-13.18%
jan 1, 1980
-199.525 mln
-70.73 mln
54.92%
jan 1, 1981
-224.575 mln
-25.05 mln
12.56%
jan 1, 1982
-261.023 mln
-36.447 mln
16.23%
Ranking of countries by current statistics by years


Comments: