29
/
en
AIzaSyAYiBZKx7MnpbEhh9jyipgxe19OcubqV5w
April 1, 2024
264653
Togo
TGO
true
2
1
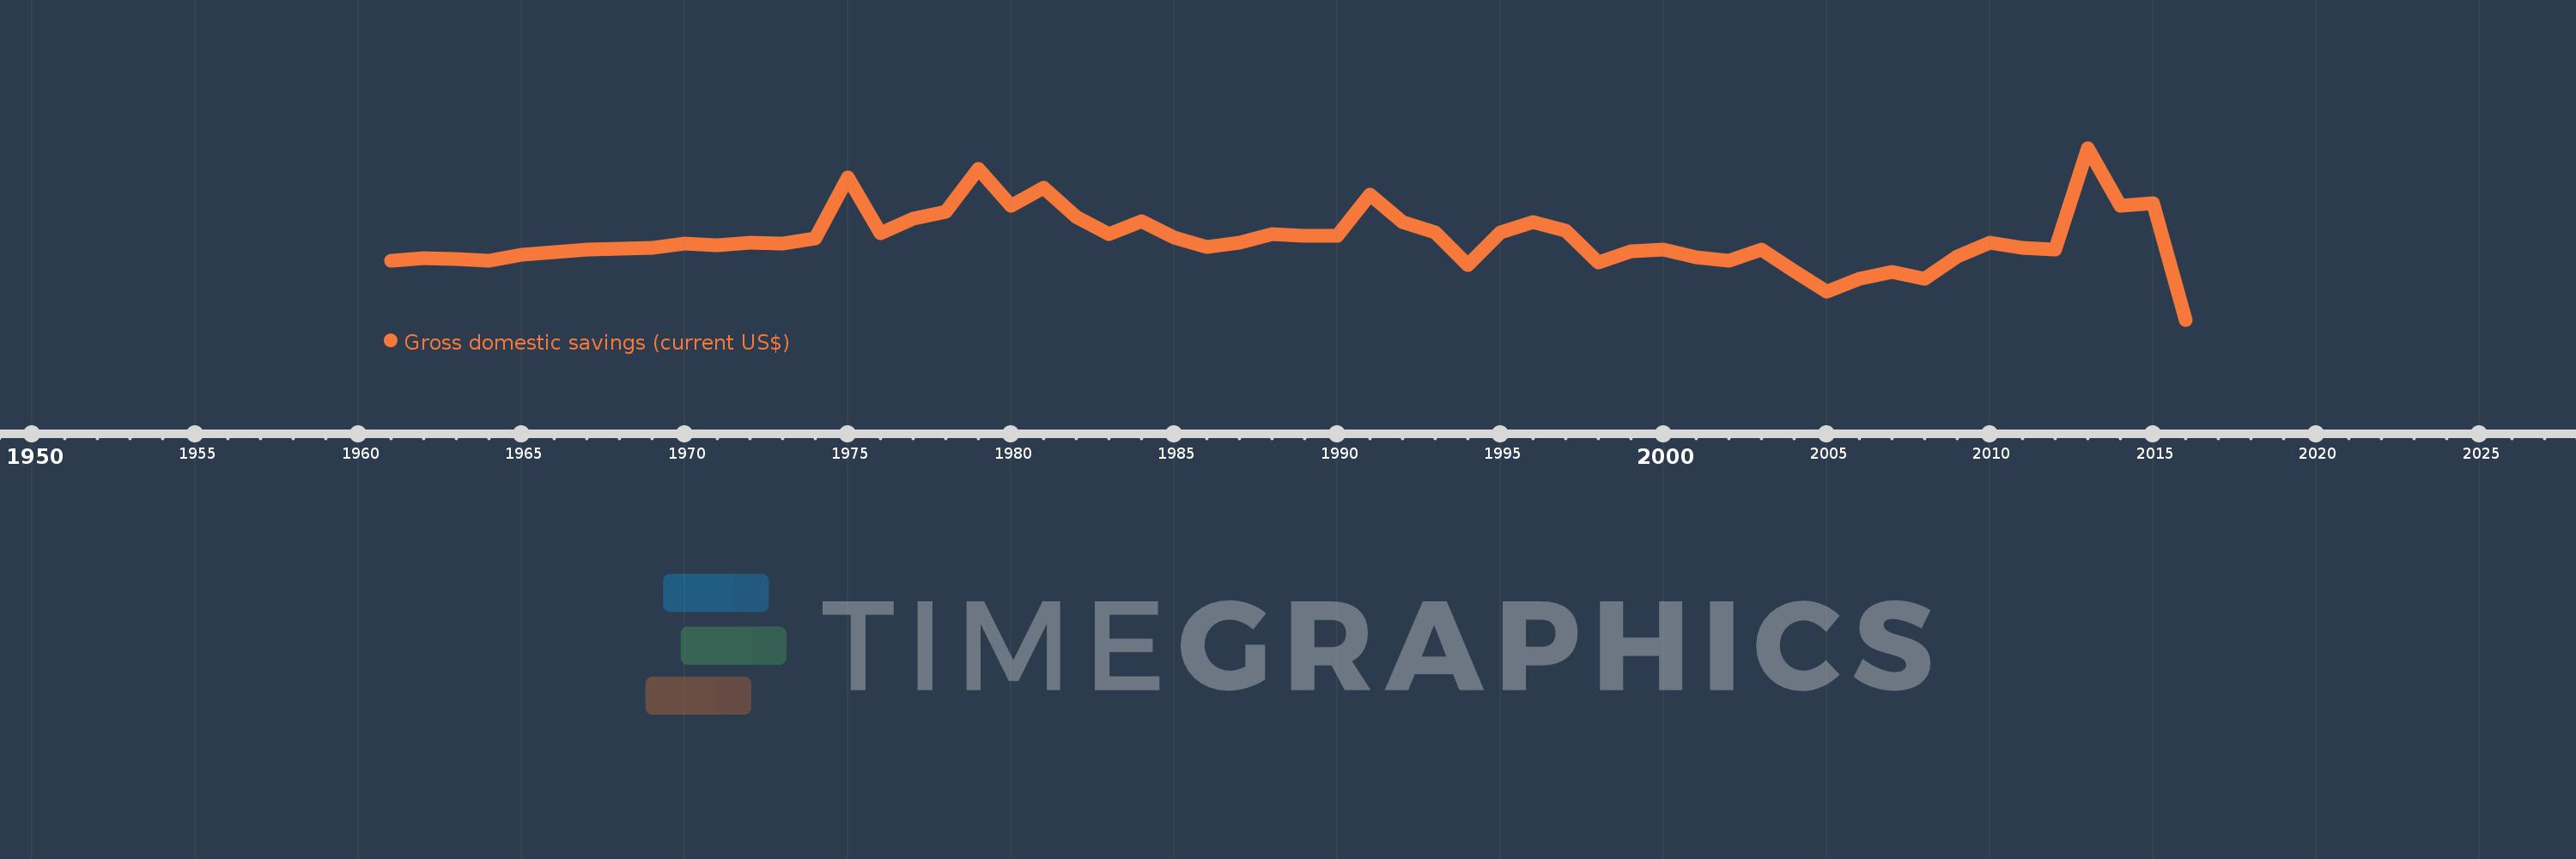
Gross domestic savings (current US$)
2016,2015,2014,2013,2012,2011,2010,2009,2008,2007,2006,2005,2004,2003,2002,2001,2000,1999,1998,1997,1996,1995,1994,1993,1992,1991,1990,1989,1988,1987,1986,1985,1984,1983,1982,1981,1980,1979,1978,1977,1976,1975,1974,1973,1972,1971,1970,1969,1968,1967,1966,1965,1964,1963,1962,1961
This statistics in other country:
AfghanistanAlbaniaAlgeriaAngolaAntigua and BarbudaArab WorldArgentinaArmeniaArubaAustraliaAustriaAzerbaijanBahamas, TheBahrainBangladeshBarbadosBelarusBelgiumBelizeBeninBermudaBhutanBoliviaBosnia and HerzegovinaBotswanaBrazilBrunei DarussalamBulgariaBurkina FasoBurundiCabo VerdeCambodiaCameroonCanadaCaribbean small statesCentral African RepublicCentral Europe and the BalticsChadChileChinaColombiaComorosCongo, Dem. Rep.Congo, Rep.Costa RicaCote d'IvoireCroatiaCubaCyprusCzech RepublicDenmarkDjiboutiDominicaDominican RepublicEarly-demographic dividendEast Asia & PacificEast Asia & Pacific (excluding high income)East Asia & Pacific (IDA & IBRD countries)EcuadorEgypt, Arab Rep.El SalvadorEquatorial GuineaEritreaEstoniaEthiopiaEuro areaEurope & Central AsiaEurope & Central Asia (excluding high income)Europe & Central Asia (IDA & IBRD countries)European UnionFaroe IslandsFijiFinlandFragile and conflict affected situationsFranceGabonGambia, TheGeorgiaGermanyGhanaGreeceGrenadaGuatemalaGuineaGuinea-BissauGuyanaHaitiHeavily indebted poor countries (HIPC)High incomeHondurasHong Kong SAR, ChinaHungaryIBRD onlyIcelandIDA & IBRD totalIDA blendIDA onlyIDA totalIndiaIndonesiaIran, Islamic Rep.IraqIrelandIsraelItalyJamaicaJapanJordanKazakhstanKenyaKiribatiKorea, Rep.KosovoKuwaitKyrgyz RepublicLao PDRLate-demographic dividendLatin America & Caribbean Latin America & Caribbean (excluding high income)Latin America & the Caribbean (IDA & IBRD countries)LatviaLeast developed countries: UN classificationLebanonLesothoLiberiaLibyaLithuaniaLow & middle incomeLow incomeLower middle incomeLuxembourgMacao SAR, ChinaMacedonia, FYRMadagascarMalawiMalaysiaMaldivesMaliMaltaMauritaniaMauritiusMexicoMicronesia, Fed. Sts.Middle East & North AfricaMiddle East & North Africa (excluding high income)Middle East & North Africa (IDA & IBRD countries)Middle incomeMoldovaMongoliaMontenegroMoroccoMozambiqueNamibiaNepalNetherlandsNew CaledoniaNew ZealandNicaraguaNigerNigeriaNorth AmericaNorwayOECD membersOmanOther small statesPakistanPanamaPapua New GuineaParaguayPeruPhilippinesPolandPortugalPost-demographic dividendPre-demographic dividendPuerto RicoQatarRomaniaRussian FederationRwandaSaudi ArabiaSenegalSerbiaSeychellesSierra LeoneSingaporeSlovak RepublicSloveniaSmall statesSolomon IslandsSouth AfricaSouth AsiaSouth Asia (IDA & IBRD)South SudanSpainSri LankaSt. Kitts and NevisSt. LuciaSt. Vincent and the GrenadinesSub-Saharan Africa Sub-Saharan Africa (excluding high income)Sub-Saharan Africa (IDA & IBRD countries)SudanSurinameSwazilandSwedenSwitzerlandSyrian Arab RepublicTajikistanTanzaniaThailandTimor-LesteTogoTongaTrinidad and TobagoTunisiaTurkeyTurkmenistanUgandaUkraineUnited Arab EmiratesUnited KingdomUnited StatesUpper middle incomeUruguayUzbekistanVanuatuVenezuela, RBVietnamWest Bank and GazaWorldYemen, Rep.ZambiaZimbabwe Timeline:
This timeline shows a graph from 1961 to 2016 of Togo. No data until 1960. Number of actual observations by date: 56.
Source name:
World Development Indicators
Source organization:
World Bank national accounts data, and OECD National Accounts data files.
Categories, topics:
Economy & Growth
Last updated:
apr 23, 2017
Indicators value changes by year
Minimum:
-190.123 mln
jan 1, 2016
Maximum:
400.515 mln
jan 1, 2013
At the date of observation
Value
Absolute change
Change from previous value
jan 1, 1961
12.545 mln
+12.545 mln
0.0%
jan 1, 1962
21.592 mln
+9.047 mln
72.12%
jan 1, 1963
19.582 mln
-2.01 mln
-9.31%
jan 1, 1964
12.066 mln
-7.516 mln
-38.38%
jan 1, 1965
32.623 mln
+20.557 mln
170.38%
jan 1, 1966
43.66 mln
+11.037 mln
33.83%
jan 1, 1967
51.973 mln
+8.313 mln
19.04%
jan 1, 1968
53.186 mln
+1.212 mln
2.33%
jan 1, 1969
57.918 mln
+4.733 mln
8.9%
jan 1, 1970
71.668 mln
+13.75 mln
23.74%
jan 1, 1971
65.899 mln
-5.768 mln
-8.05%
jan 1, 1972
73.999 mln
+8.1 mln
12.29%
jan 1, 1973
72.122 mln
-1.878 mln
-2.54%
jan 1, 1974
88.891 mln
+16.769 mln
23.25%
jan 1, 1975
299.861 mln
+210.97 mln
237.34%
jan 1, 1976
107.273 mln
-192.588 mln
-64.23%
jan 1, 1977
158.823 mln
+51.55 mln
48.06%
jan 1, 1978
181.545 mln
+22.722 mln
14.31%
jan 1, 1979
327.933 mln
+146.388 mln
80.63%
jan 1, 1980
201.368 mln
-126.564 mln
-38.59%
jan 1, 1981
263.158 mln
+61.79 mln
30.68%
jan 1, 1982
164.501 mln
-98.658 mln
-37.49%
jan 1, 1983
105.293 mln
-59.207 mln
-35.99%
jan 1, 1984
148.006 mln
+42.713 mln
40.57%
jan 1, 1985
92.915 mln
-55.09 mln
-37.22%
jan 1, 1986
60.477 mln
-32.439 mln
-34.91%
jan 1, 1987
75.598 mln
+15.121 mln
25.0%
jan 1, 1988
103.215 mln
+27.618 mln
36.53%
jan 1, 1989
97.774 mln
-5.441 mln
-5.27%
jan 1, 1990
99.402 mln
+1.627 mln
1.66%
jan 1, 1991
239.535 mln
+140.133 mln
140.98%
jan 1, 1992
144.575 mln
-94.96 mln
-39.64%
jan 1, 1993
109.946 mln
-34.629 mln
-23.95%
jan 1, 1994
-2.871 mln
-112.817 mln
-102.61%
jan 1, 1995
111.406 mln
+114.277 mln
-3.98K%
jan 1, 1996
146.09 mln
+34.684 mln
31.13%
jan 1, 1997
115.922 mln
-30.168 mln
-20.65%
jan 1, 1998
6.849 mln
-109.072 mln
-94.09%
jan 1, 1999
44.798 mln
+37.948 mln
554.03%
jan 1, 2000
50.43 mln
+5.633 mln
12.57%
jan 1, 2001
25.338 mln
-25.093 mln
-49.76%
jan 1, 2002
12.391 mln
-12.947 mln
-51.1%
jan 1, 2003
52.505 mln
+40.114 mln
323.73%
jan 1, 2004
-22.085 mln
-74.589 mln
-142.06%
jan 1, 2005
-92.788 mln
-70.703 mln
320.15%
jan 1, 2006
-49.044 mln
+43.744 mln
-47.14%
jan 1, 2007
-25.134 mln
+23.91 mln
-48.75%
jan 1, 2008
-48.691 mln
-23.557 mln
93.72%
jan 1, 2009
27.8 mln
+76.49 mln
-157.09%
jan 1, 2010
75.23 mln
+47.43 mln
170.62%
jan 1, 2011
56.659 mln
-18.571 mln
-24.69%
jan 1, 2012
51.223 mln
-5.436 mln
-9.59%
jan 1, 2013
400.515 mln
+349.291 mln
681.9%
jan 1, 2014
201.764 mln
-198.751 mln
-49.62%
jan 1, 2015
211.639 mln
+9.876 mln
4.89%
jan 1, 2016
-190.123 mln
-401.762 mln
-189.83%
Ranking of countries by current statistics by years


Comments: