29
/
en
AIzaSyAYiBZKx7MnpbEhh9jyipgxe19OcubqV5w
April 1, 2024
257357
Switzerland
CHE
true
2
1
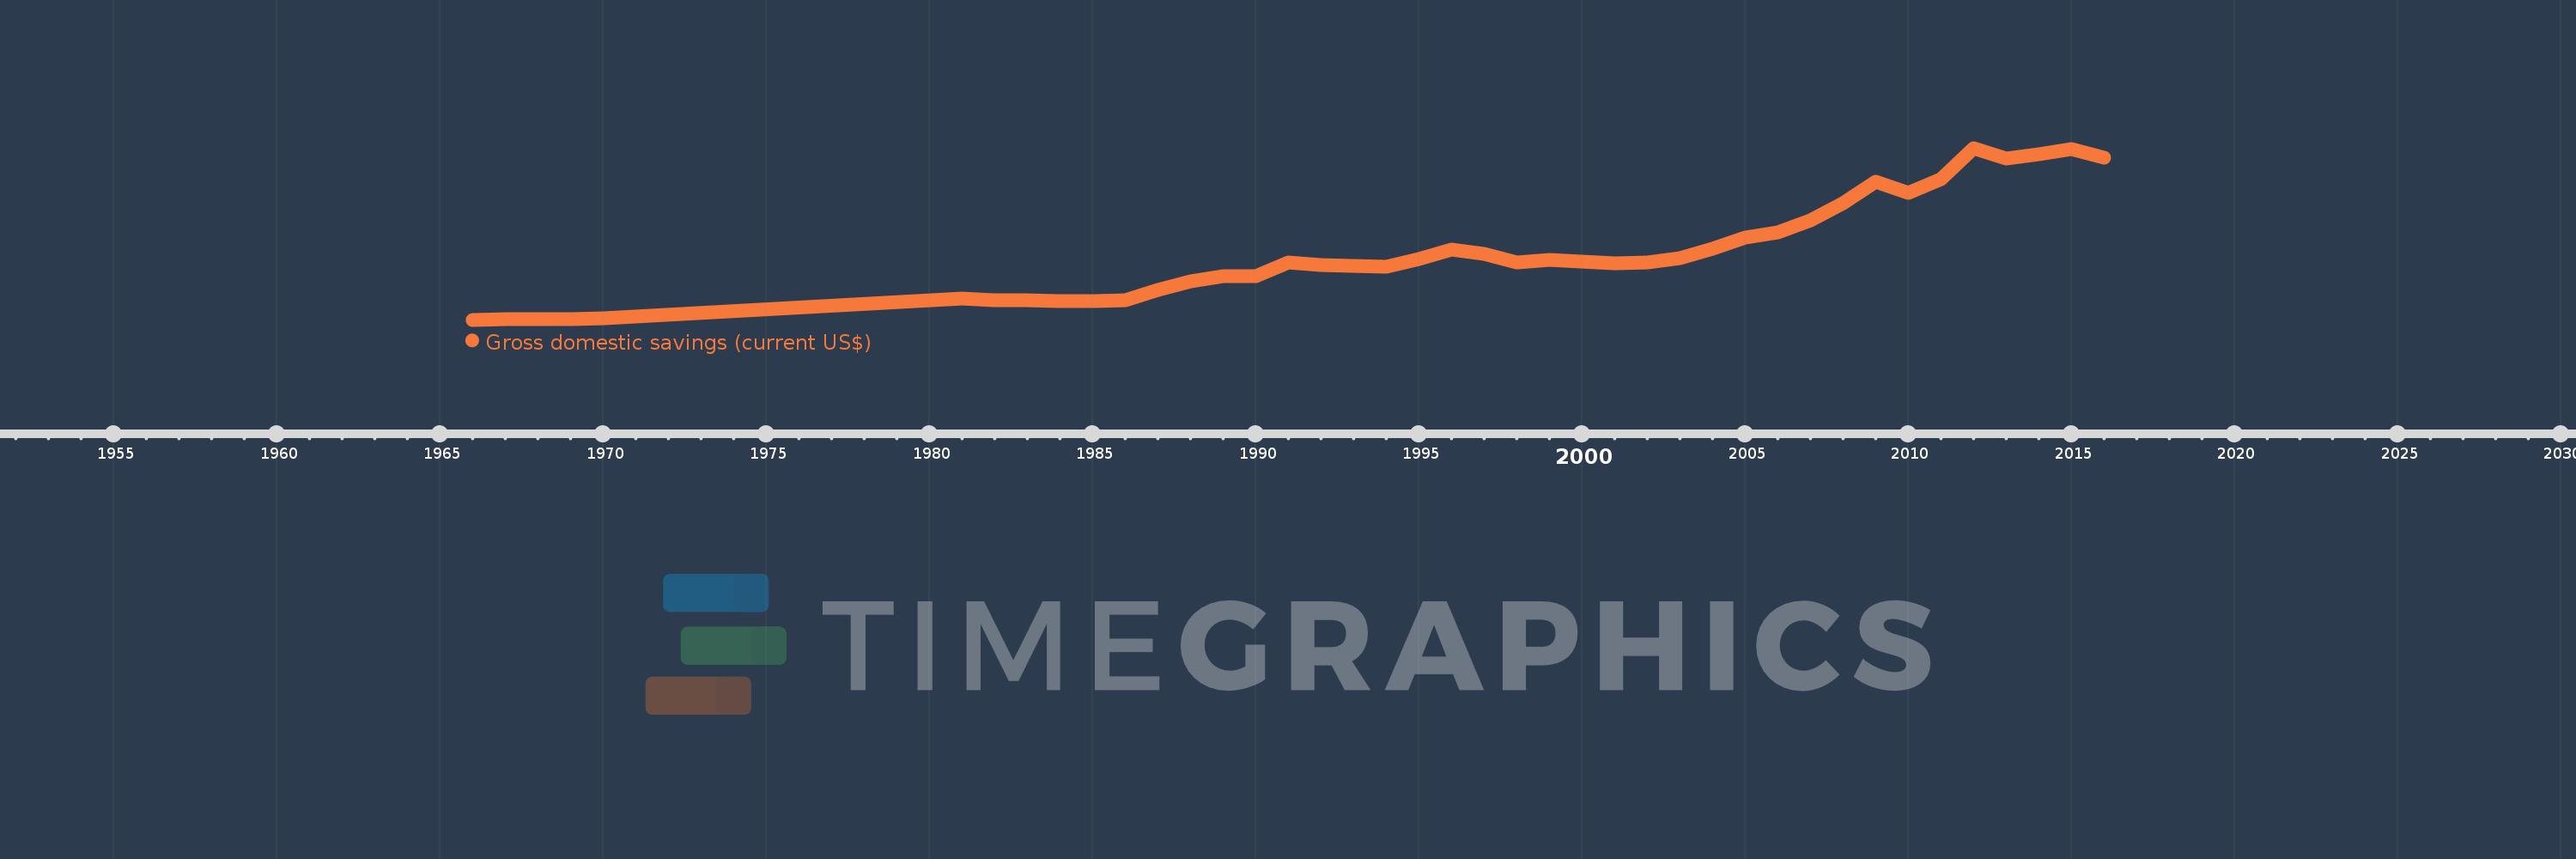
Gross domestic savings (current US$)
2016,2015,2014,2013,2012,2011,2010,2009,2008,2007,2006,2005,2004,2003,2002,2001,2000,1999,1998,1997,1996,1995,1994,1993,1992,1991,1990,1989,1988,1987,1986,1985,1984,1983,1982,1981,1970,1969,1968,1967,1966
This statistics in other country:
AfghanistanAlbaniaAlgeriaAngolaAntigua and BarbudaArab WorldArgentinaArmeniaArubaAustraliaAustriaAzerbaijanBahamas, TheBahrainBangladeshBarbadosBelarusBelgiumBelizeBeninBermudaBhutanBoliviaBosnia and HerzegovinaBotswanaBrazilBrunei DarussalamBulgariaBurkina FasoBurundiCabo VerdeCambodiaCameroonCanadaCaribbean small statesCentral African RepublicCentral Europe and the BalticsChadChileChinaColombiaComorosCongo, Dem. Rep.Congo, Rep.Costa RicaCote d'IvoireCroatiaCubaCyprusCzech RepublicDenmarkDjiboutiDominicaDominican RepublicEarly-demographic dividendEast Asia & PacificEast Asia & Pacific (excluding high income)East Asia & Pacific (IDA & IBRD countries)EcuadorEgypt, Arab Rep.El SalvadorEquatorial GuineaEritreaEstoniaEthiopiaEuro areaEurope & Central AsiaEurope & Central Asia (excluding high income)Europe & Central Asia (IDA & IBRD countries)European UnionFaroe IslandsFijiFinlandFragile and conflict affected situationsFranceGabonGambia, TheGeorgiaGermanyGhanaGreeceGrenadaGuatemalaGuineaGuinea-BissauGuyanaHaitiHeavily indebted poor countries (HIPC)High incomeHondurasHong Kong SAR, ChinaHungaryIBRD onlyIcelandIDA & IBRD totalIDA blendIDA onlyIDA totalIndiaIndonesiaIran, Islamic Rep.IraqIrelandIsraelItalyJamaicaJapanJordanKazakhstanKenyaKiribatiKorea, Rep.KosovoKuwaitKyrgyz RepublicLao PDRLate-demographic dividendLatin America & Caribbean Latin America & Caribbean (excluding high income)Latin America & the Caribbean (IDA & IBRD countries)LatviaLeast developed countries: UN classificationLebanonLesothoLiberiaLibyaLithuaniaLow & middle incomeLow incomeLower middle incomeLuxembourgMacao SAR, ChinaMacedonia, FYRMadagascarMalawiMalaysiaMaldivesMaliMaltaMauritaniaMauritiusMexicoMicronesia, Fed. Sts.Middle East & North AfricaMiddle East & North Africa (excluding high income)Middle East & North Africa (IDA & IBRD countries)Middle incomeMoldovaMongoliaMontenegroMoroccoMozambiqueNamibiaNepalNetherlandsNew CaledoniaNew ZealandNicaraguaNigerNigeriaNorth AmericaNorwayOECD membersOmanOther small statesPakistanPanamaPapua New GuineaParaguayPeruPhilippinesPolandPortugalPost-demographic dividendPre-demographic dividendPuerto RicoQatarRomaniaRussian FederationRwandaSaudi ArabiaSenegalSerbiaSeychellesSierra LeoneSingaporeSlovak RepublicSloveniaSmall statesSolomon IslandsSouth AfricaSouth AsiaSouth Asia (IDA & IBRD)South SudanSpainSri LankaSt. Kitts and NevisSt. LuciaSt. Vincent and the GrenadinesSub-Saharan Africa Sub-Saharan Africa (excluding high income)Sub-Saharan Africa (IDA & IBRD countries)SudanSurinameSwazilandSwedenSwitzerlandSyrian Arab RepublicTajikistanTanzaniaThailandTimor-LesteTogoTongaTrinidad and TobagoTunisiaTurkeyTurkmenistanUgandaUkraineUnited Arab EmiratesUnited KingdomUnited StatesUpper middle incomeUruguayUzbekistanVanuatuVenezuela, RBVietnamWest Bank and GazaWorldYemen, Rep.ZambiaZimbabwe Timeline:
This timeline shows a graph from 1966 to 2016 of Switzerland. No data until 1965. Number of actual observations by date: 41.
Source name:
World Development Indicators
Source organization:
World Bank national accounts data, and OECD National Accounts data files.
Categories, topics:
Economy & Growth
Last updated:
apr 23, 2017
Indicators value changes by year
Minimum:
5.257 bln
jan 1, 1966
Maximum:
246.084 bln
jan 1, 2012
At the date of observation
Value
Absolute change
Change from previous value
jan 1, 1966
5.257 bln
+5.257 bln
0.0%
jan 1, 1967
5.58 bln
+323.642 mln
6.16%
jan 1, 1968
5.998 bln
+417.723 mln
7.49%
jan 1, 1969
6.404 bln
+406.16 mln
6.77%
jan 1, 1970
6.938 bln
+533.657 mln
8.33%
jan 1, 1981
34.903 bln
+27.966 bln
403.1%
jan 1, 1982
32.217 bln
-2.686 bln
-7.7%
jan 1, 1983
32.824 bln
+606.938 mln
1.88%
jan 1, 1984
31.172 bln
-1.652 bln
-5.03%
jan 1, 1985
31.405 bln
+232.762 mln
0.75%
jan 1, 1986
32.539 bln
+1.135 bln
3.61%
jan 1, 1987
47.352 bln
+14.812 bln
45.52%
jan 1, 1988
59.446 bln
+12.095 bln
25.54%
jan 1, 1989
66.698 bln
+7.252 bln
12.2%
jan 1, 1990
65.919 bln
-779.148 mln
-1.17%
jan 1, 1991
86.172 bln
+20.253 bln
30.72%
jan 1, 1992
81.84 bln
-4.332 bln
-5.03%
jan 1, 1993
80.441 bln
-1.399 bln
-1.71%
jan 1, 1994
79.13 bln
-1.311 bln
-1.63%
jan 1, 1995
90.205 bln
+11.075 bln
14.0%
jan 1, 1996
103.959 bln
+13.754 bln
15.25%
jan 1, 1997
97.542 bln
-6.417 bln
-6.17%
jan 1, 1998
85.004 bln
-12.538 bln
-12.85%
jan 1, 1999
89.048 bln
+4.043 bln
4.76%
jan 1, 2000
86.887 bln
-2.161 bln
-2.43%
jan 1, 2001
84.609 bln
-2.278 bln
-2.62%
jan 1, 2002
85.396 bln
+787.24 mln
0.93%
jan 1, 2003
91.004 bln
+5.608 bln
6.57%
jan 1, 2004
105.068 bln
+14.064 bln
15.45%
jan 1, 2005
120.005 bln
+14.937 bln
14.22%
jan 1, 2006
127.555 bln
+7.55 bln
6.29%
jan 1, 2007
143.975 bln
+16.42 bln
12.87%
jan 1, 2008
169.133 bln
+25.158 bln
17.47%
jan 1, 2009
198.627 bln
+29.494 bln
17.44%
jan 1, 2010
183.16 bln
-15.468 bln
-7.79%
jan 1, 2011
202.234 bln
+19.075 bln
10.41%
jan 1, 2012
246.084 bln
+43.85 bln
21.68%
jan 1, 2013
230.766 bln
-15.318 bln
-6.22%
jan 1, 2014
237.62 bln
+6.854 bln
2.97%
jan 1, 2015
245.046 bln
+7.426 bln
3.13%
jan 1, 2016
233.077 bln
-11.969 bln
-4.88%
Ranking of countries by current statistics by years


Comments: