29
/
en
AIzaSyAYiBZKx7MnpbEhh9jyipgxe19OcubqV5w
April 1, 2024
113637
Cote d'Ivoire
CIV
true
2
1
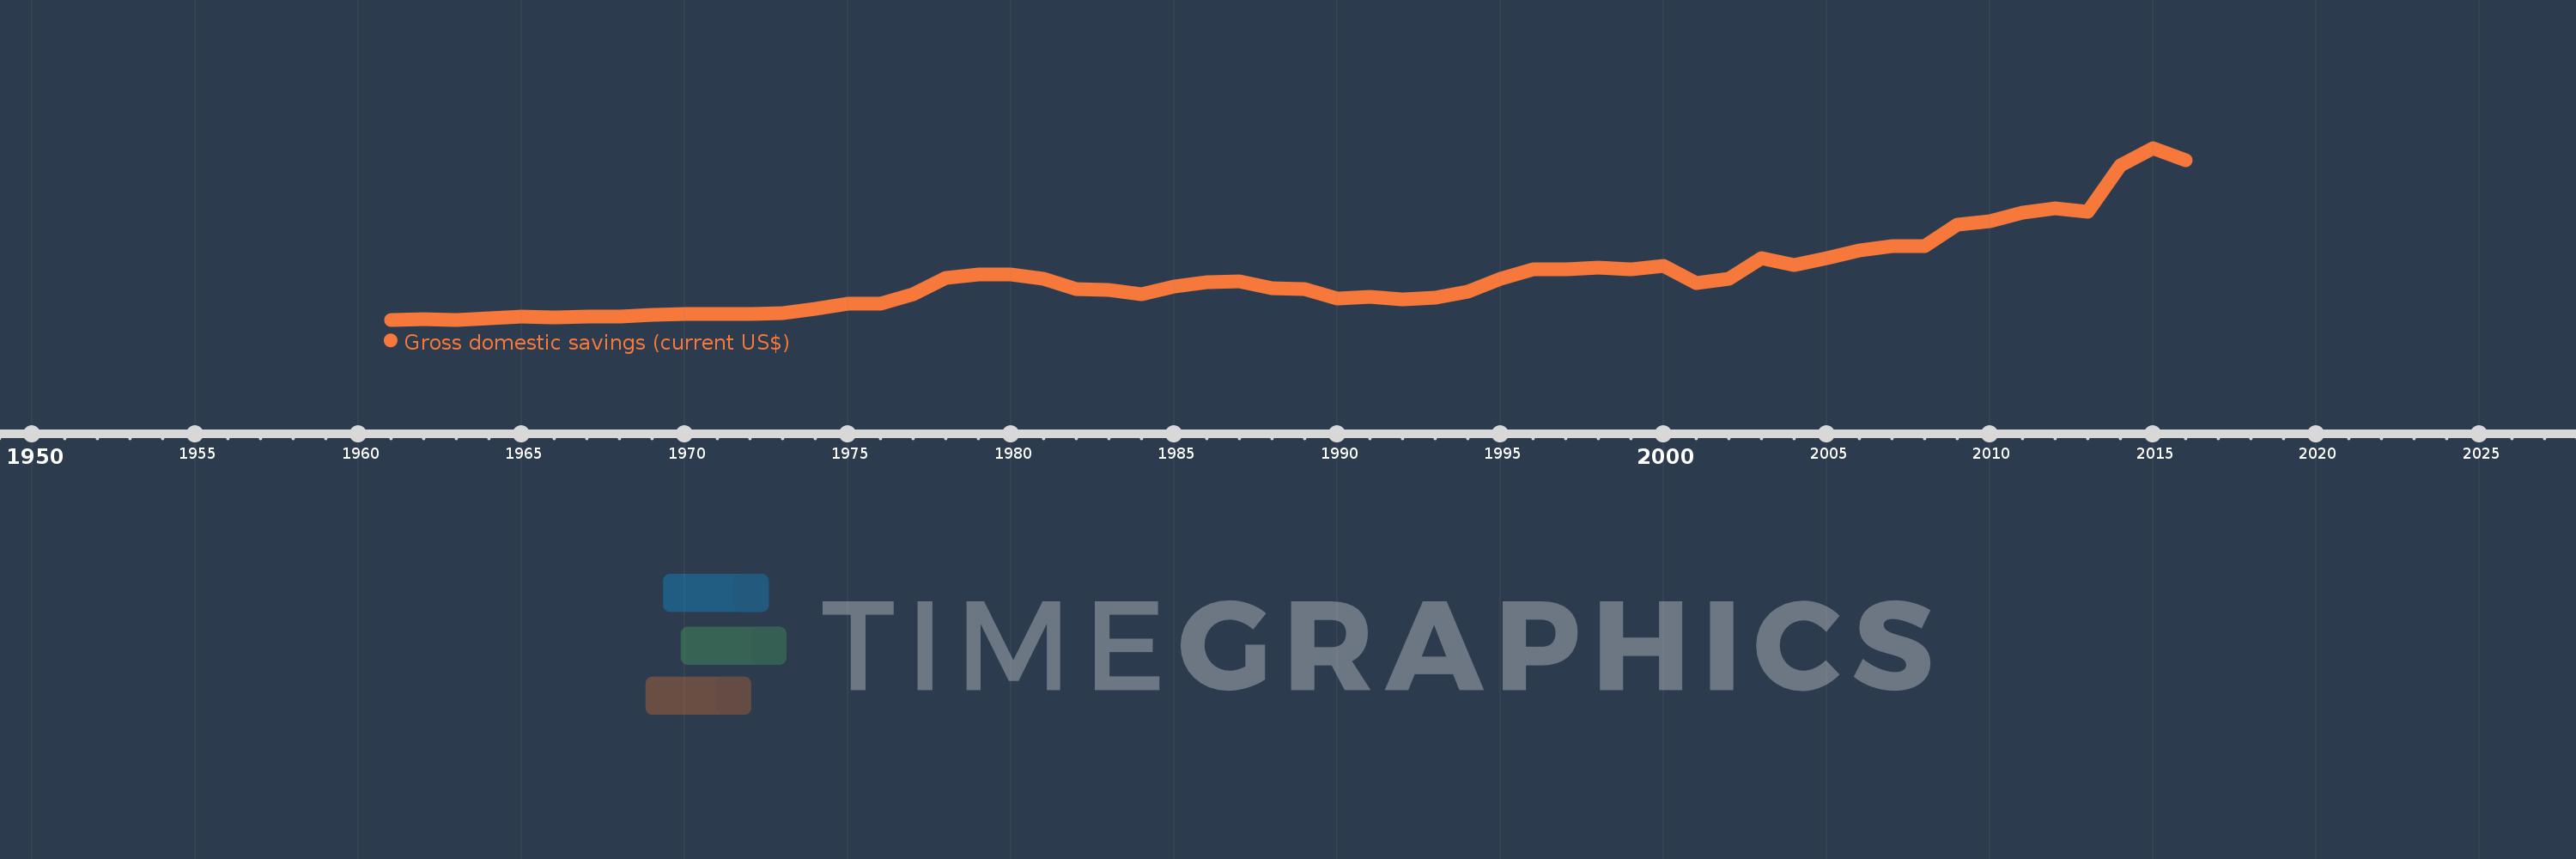
Gross domestic savings (current US$)
2016,2015,2014,2013,2012,2011,2010,2009,2008,2007,2006,2005,2004,2003,2002,2001,2000,1999,1998,1997,1996,1995,1994,1993,1992,1991,1990,1989,1988,1987,1986,1985,1984,1983,1982,1981,1980,1979,1978,1977,1976,1975,1974,1973,1972,1971,1970,1969,1968,1967,1966,1965,1964,1963,1962,1961
This statistics in other country:
AfghanistanAlbaniaAlgeriaAngolaAntigua and BarbudaArab WorldArgentinaArmeniaArubaAustraliaAustriaAzerbaijanBahamas, TheBahrainBangladeshBarbadosBelarusBelgiumBelizeBeninBermudaBhutanBoliviaBosnia and HerzegovinaBotswanaBrazilBrunei DarussalamBulgariaBurkina FasoBurundiCabo VerdeCambodiaCameroonCanadaCaribbean small statesCentral African RepublicCentral Europe and the BalticsChadChileChinaColombiaComorosCongo, Dem. Rep.Congo, Rep.Costa RicaCote d'IvoireCroatiaCubaCyprusCzech RepublicDenmarkDjiboutiDominicaDominican RepublicEarly-demographic dividendEast Asia & PacificEast Asia & Pacific (excluding high income)East Asia & Pacific (IDA & IBRD countries)EcuadorEgypt, Arab Rep.El SalvadorEquatorial GuineaEritreaEstoniaEthiopiaEuro areaEurope & Central AsiaEurope & Central Asia (excluding high income)Europe & Central Asia (IDA & IBRD countries)European UnionFaroe IslandsFijiFinlandFragile and conflict affected situationsFranceGabonGambia, TheGeorgiaGermanyGhanaGreeceGrenadaGuatemalaGuineaGuinea-BissauGuyanaHaitiHeavily indebted poor countries (HIPC)High incomeHondurasHong Kong SAR, ChinaHungaryIBRD onlyIcelandIDA & IBRD totalIDA blendIDA onlyIDA totalIndiaIndonesiaIran, Islamic Rep.IraqIrelandIsraelItalyJamaicaJapanJordanKazakhstanKenyaKiribatiKorea, Rep.KosovoKuwaitKyrgyz RepublicLao PDRLate-demographic dividendLatin America & Caribbean Latin America & Caribbean (excluding high income)Latin America & the Caribbean (IDA & IBRD countries)LatviaLeast developed countries: UN classificationLebanonLesothoLiberiaLibyaLithuaniaLow & middle incomeLow incomeLower middle incomeLuxembourgMacao SAR, ChinaMacedonia, FYRMadagascarMalawiMalaysiaMaldivesMaliMaltaMauritaniaMauritiusMexicoMicronesia, Fed. Sts.Middle East & North AfricaMiddle East & North Africa (excluding high income)Middle East & North Africa (IDA & IBRD countries)Middle incomeMoldovaMongoliaMontenegroMoroccoMozambiqueNamibiaNepalNetherlandsNew CaledoniaNew ZealandNicaraguaNigerNigeriaNorth AmericaNorwayOECD membersOmanOther small statesPakistanPanamaPapua New GuineaParaguayPeruPhilippinesPolandPortugalPost-demographic dividendPre-demographic dividendPuerto RicoQatarRomaniaRussian FederationRwandaSaudi ArabiaSenegalSerbiaSeychellesSierra LeoneSingaporeSlovak RepublicSloveniaSmall statesSolomon IslandsSouth AfricaSouth AsiaSouth Asia (IDA & IBRD)South SudanSpainSri LankaSt. Kitts and NevisSt. LuciaSt. Vincent and the GrenadinesSub-Saharan Africa Sub-Saharan Africa (excluding high income)Sub-Saharan Africa (IDA & IBRD countries)SudanSurinameSwazilandSwedenSwitzerlandSyrian Arab RepublicTajikistanTanzaniaThailandTimor-LesteTogoTongaTrinidad and TobagoTunisiaTurkeyTurkmenistanUgandaUkraineUnited Arab EmiratesUnited KingdomUnited StatesUpper middle incomeUruguayUzbekistanVanuatuVenezuela, RBVietnamWest Bank and GazaWorldYemen, Rep.ZambiaZimbabwe Timeline:
This timeline shows a graph from 1961 to 2016 of Cote d'Ivoire. No data until 1960. Number of actual observations by date: 56.
Source name:
World Development Indicators
Source organization:
World Bank national accounts data, and OECD National Accounts data files.
Categories, topics:
Economy & Growth
Last updated:
apr 23, 2017
Indicators value changes by year
Minimum:
145.417 mln
jan 1, 1963
Maximum:
8.204 bln
jan 1, 2015
At the date of observation
Value
Absolute change
Change from previous value
jan 1, 1961
153.265 mln
+153.265 mln
0.0%
jan 1, 1962
167.112 mln
+13.847 mln
9.03%
jan 1, 1963
145.417 mln
-21.695 mln
-12.98%
jan 1, 1964
214.603 mln
+69.187 mln
47.58%
jan 1, 1965
304.023 mln
+89.42 mln
41.67%
jan 1, 1966
262.792 mln
-41.231 mln
-13.56%
jan 1, 1967
302.428 mln
+39.636 mln
15.08%
jan 1, 1968
294.714 mln
-7.713 mln
-2.55%
jan 1, 1969
391.009 mln
+96.294 mln
32.67%
jan 1, 1970
397.753 mln
+6.744 mln
1.72%
jan 1, 1971
424.38 mln
+26.628 mln
6.69%
jan 1, 1972
405.292 mln
-19.088 mln
-4.5%
jan 1, 1973
469.393 mln
+64.101 mln
15.82%
jan 1, 1974
644.715 mln
+175.322 mln
37.35%
jan 1, 1975
900.689 mln
+255.974 mln
39.7%
jan 1, 1976
879.555 mln
-21.134 mln
-2.35%
jan 1, 1977
1.328 bln
+448.335 mln
50.97%
jan 1, 1978
2.107 bln
+778.918 mln
58.66%
jan 1, 1979
2.279 bln
+172.326 mln
8.18%
jan 1, 1980
2.277 bln
-1.979 mln
-0.09%
jan 1, 1981
2.072 bln
-205.492 mln
-9.02%
jan 1, 1982
1.588 bln
-483.698 mln
-23.35%
jan 1, 1983
1.535 bln
-52.997 mln
-3.34%
jan 1, 1984
1.344 bln
-191.106 mln
-12.45%
jan 1, 1985
1.722 bln
+378.277 mln
28.15%
jan 1, 1986
1.907 bln
+184.762 mln
10.73%
jan 1, 1987
1.958 bln
+50.949 mln
2.67%
jan 1, 1988
1.627 bln
-331.016 mln
-16.91%
jan 1, 1989
1.564 bln
-63.09 mln
-3.88%
jan 1, 1990
1.159 bln
-404.359 mln
-25.86%
jan 1, 1991
1.216 bln
+56.991 mln
4.92%
jan 1, 1992
1.09 bln
-126.859 mln
-10.43%
jan 1, 1993
1.195 bln
+105.836 mln
9.71%
jan 1, 1994
1.472 bln
+276.987 mln
23.17%
jan 1, 1995
2.073 bln
+600.552 mln
40.79%
jan 1, 1996
2.521 bln
+447.76 mln
21.6%
jan 1, 1997
2.524 bln
+3.677 mln
0.15%
jan 1, 1998
2.585 bln
+60.207 mln
2.39%
jan 1, 1999
2.516 bln
-69.011 mln
-2.67%
jan 1, 2000
2.67 bln
+154.447 mln
6.14%
jan 1, 2001
1.866 bln
-804.265 mln
-30.12%
jan 1, 2002
2.056 bln
+189.902 mln
10.18%
jan 1, 2003
3.016 bln
+960.226 mln
46.71%
jan 1, 2004
2.693 bln
-322.711 mln
-10.7%
jan 1, 2005
3.03 bln
+337.098 mln
12.52%
jan 1, 2006
3.385 bln
+354.798 mln
11.71%
jan 1, 2007
3.606 bln
+220.88 mln
6.53%
jan 1, 2008
3.598 bln
-8.217 mln
-0.23%
jan 1, 2009
4.609 bln
+1.011 bln
28.11%
jan 1, 2010
4.765 bln
+155.674 mln
3.38%
jan 1, 2011
5.162 bln
+396.939 mln
8.33%
jan 1, 2012
5.378 bln
+216.298 mln
4.19%
jan 1, 2013
5.209 bln
-169.284 mln
-3.15%
jan 1, 2014
7.393 bln
+2.184 bln
41.93%
jan 1, 2015
8.204 bln
+810.772 mln
10.97%
jan 1, 2016
7.641 bln
-562.083 mln
-6.85%
Ranking of countries by current statistics by years


Comments: