29
/
en
AIzaSyAYiBZKx7MnpbEhh9jyipgxe19OcubqV5w
April 1, 2024
182978
Macao SAR, China
MAC
true
2
1
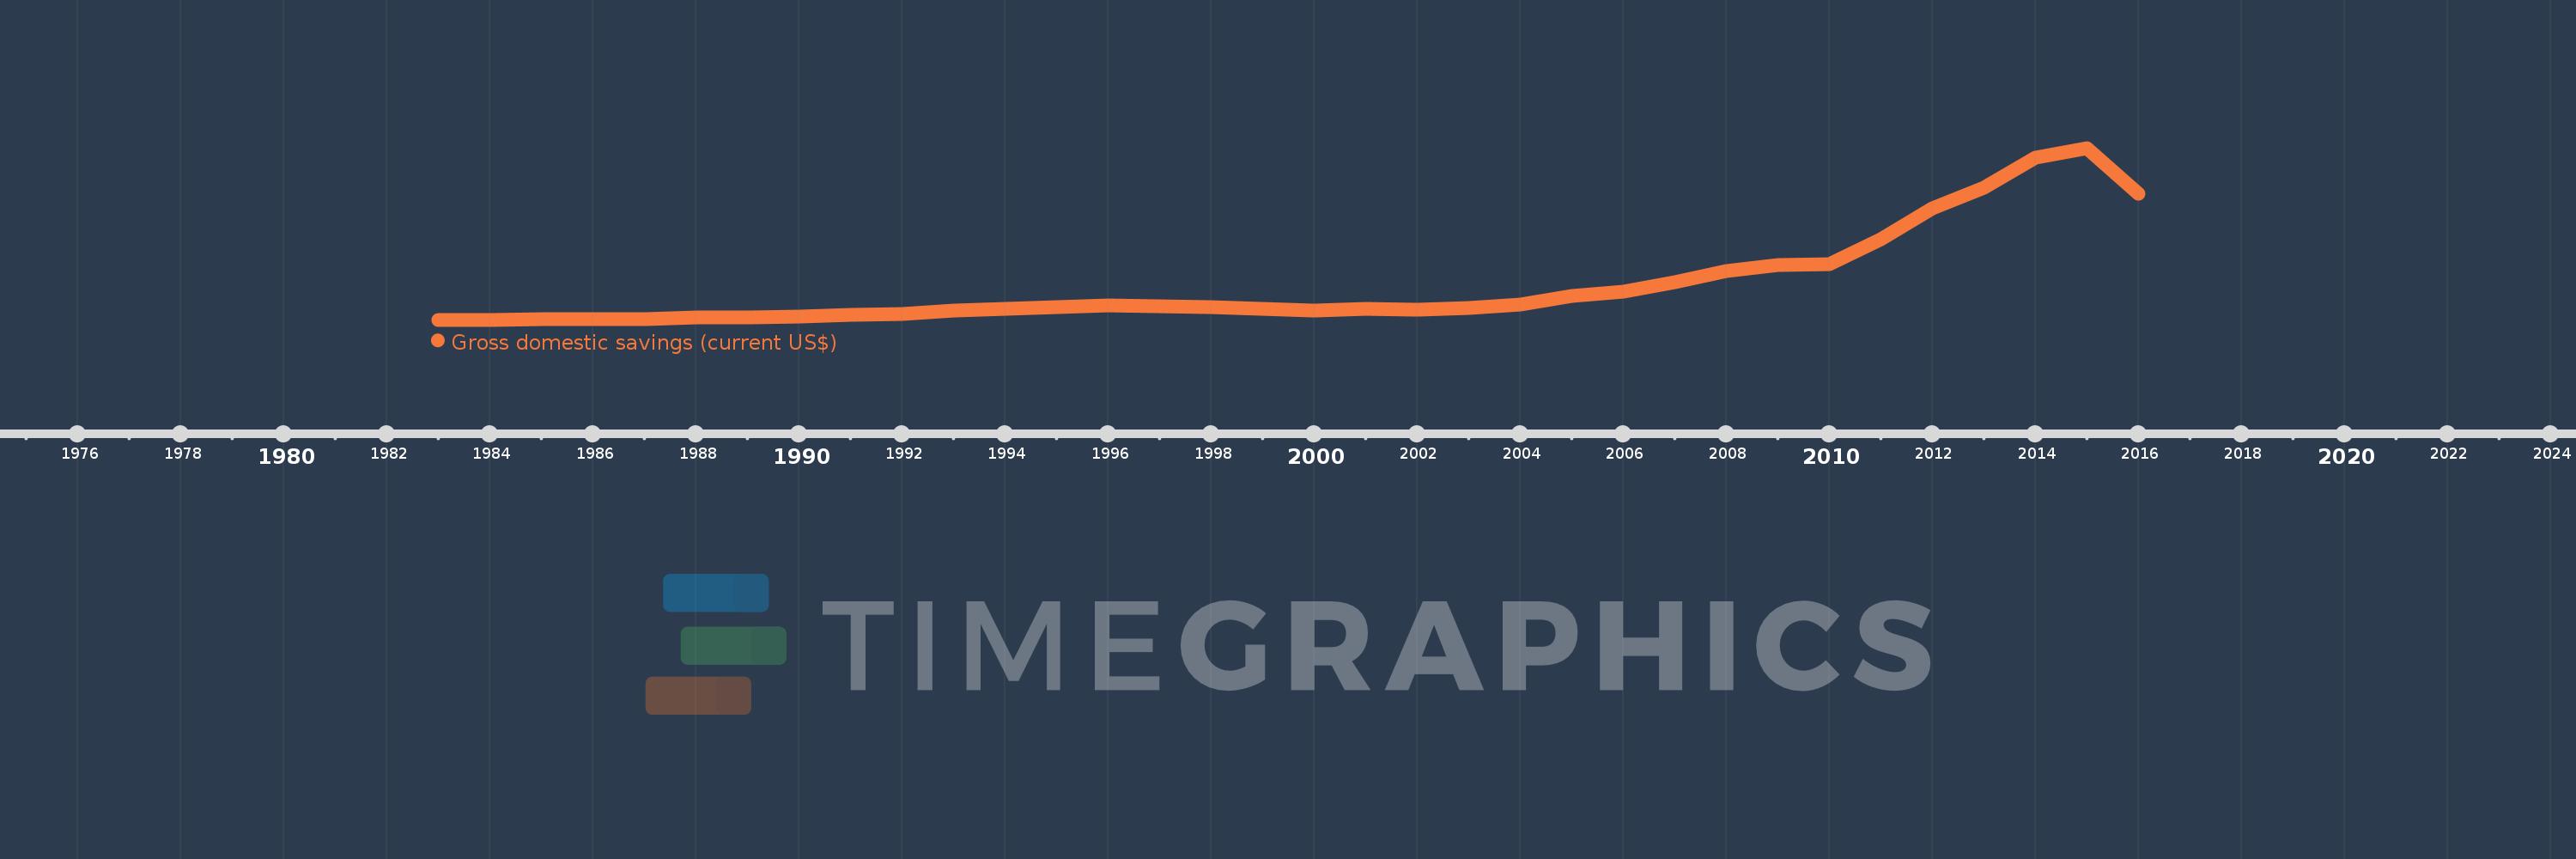
Gross domestic savings (current US$)
2016,2015,2014,2013,2012,2011,2010,2009,2008,2007,2006,2005,2004,2003,2002,2001,2000,1999,1998,1997,1996,1995,1994,1993,1992,1991,1990,1989,1988,1987,1986,1985,1984,1983
This statistics in other country:
AfghanistanAlbaniaAlgeriaAngolaAntigua and BarbudaArab WorldArgentinaArmeniaArubaAustraliaAustriaAzerbaijanBahamas, TheBahrainBangladeshBarbadosBelarusBelgiumBelizeBeninBermudaBhutanBoliviaBosnia and HerzegovinaBotswanaBrazilBrunei DarussalamBulgariaBurkina FasoBurundiCabo VerdeCambodiaCameroonCanadaCaribbean small statesCentral African RepublicCentral Europe and the BalticsChadChileChinaColombiaComorosCongo, Dem. Rep.Congo, Rep.Costa RicaCote d'IvoireCroatiaCubaCyprusCzech RepublicDenmarkDjiboutiDominicaDominican RepublicEarly-demographic dividendEast Asia & PacificEast Asia & Pacific (excluding high income)East Asia & Pacific (IDA & IBRD countries)EcuadorEgypt, Arab Rep.El SalvadorEquatorial GuineaEritreaEstoniaEthiopiaEuro areaEurope & Central AsiaEurope & Central Asia (excluding high income)Europe & Central Asia (IDA & IBRD countries)European UnionFaroe IslandsFijiFinlandFragile and conflict affected situationsFranceGabonGambia, TheGeorgiaGermanyGhanaGreeceGrenadaGuatemalaGuineaGuinea-BissauGuyanaHaitiHeavily indebted poor countries (HIPC)High incomeHondurasHong Kong SAR, ChinaHungaryIBRD onlyIcelandIDA & IBRD totalIDA blendIDA onlyIDA totalIndiaIndonesiaIran, Islamic Rep.IraqIrelandIsraelItalyJamaicaJapanJordanKazakhstanKenyaKiribatiKorea, Rep.KosovoKuwaitKyrgyz RepublicLao PDRLate-demographic dividendLatin America & Caribbean Latin America & Caribbean (excluding high income)Latin America & the Caribbean (IDA & IBRD countries)LatviaLeast developed countries: UN classificationLebanonLesothoLiberiaLibyaLithuaniaLow & middle incomeLow incomeLower middle incomeLuxembourgMacao SAR, ChinaMacedonia, FYRMadagascarMalawiMalaysiaMaldivesMaliMaltaMauritaniaMauritiusMexicoMicronesia, Fed. Sts.Middle East & North AfricaMiddle East & North Africa (excluding high income)Middle East & North Africa (IDA & IBRD countries)Middle incomeMoldovaMongoliaMontenegroMoroccoMozambiqueNamibiaNepalNetherlandsNew CaledoniaNew ZealandNicaraguaNigerNigeriaNorth AmericaNorwayOECD membersOmanOther small statesPakistanPanamaPapua New GuineaParaguayPeruPhilippinesPolandPortugalPost-demographic dividendPre-demographic dividendPuerto RicoQatarRomaniaRussian FederationRwandaSaudi ArabiaSenegalSerbiaSeychellesSierra LeoneSingaporeSlovak RepublicSloveniaSmall statesSolomon IslandsSouth AfricaSouth AsiaSouth Asia (IDA & IBRD)South SudanSpainSri LankaSt. Kitts and NevisSt. LuciaSt. Vincent and the GrenadinesSub-Saharan Africa Sub-Saharan Africa (excluding high income)Sub-Saharan Africa (IDA & IBRD countries)SudanSurinameSwazilandSwedenSwitzerlandSyrian Arab RepublicTajikistanTanzaniaThailandTimor-LesteTogoTongaTrinidad and TobagoTunisiaTurkeyTurkmenistanUgandaUkraineUnited Arab EmiratesUnited KingdomUnited StatesUpper middle incomeUruguayUzbekistanVanuatuVenezuela, RBVietnamWest Bank and GazaWorldYemen, Rep.ZambiaZimbabwe Timeline:
This timeline shows a graph from 1983 to 2016 of Macao SAR, China. No data until 1982. Number of actual observations by date: 34.
Source name:
World Development Indicators
Source organization:
World Bank national accounts data, and OECD National Accounts data files.
Categories, topics:
Economy & Growth
Last updated:
apr 23, 2017
Indicators value changes by year
Minimum:
416.492 mln
jan 1, 1983
Maximum:
40.557 bln
jan 1, 2015
At the date of observation
Value
Absolute change
Change from previous value
jan 1, 1983
416.492 mln
+416.492 mln
0.0%
jan 1, 1984
435.338 mln
+18.846 mln
4.52%
jan 1, 1985
556.851 mln
+121.513 mln
27.91%
jan 1, 1986
533.72 mln
-23.13 mln
-4.15%
jan 1, 1987
609.053 mln
+75.333 mln
14.11%
jan 1, 1988
903.847 mln
+294.793 mln
48.4%
jan 1, 1989
1.025 bln
+121.511 mln
13.44%
jan 1, 1990
1.23 bln
+204.642 mln
19.96%
jan 1, 1991
1.524 bln
+294.304 mln
23.93%
jan 1, 1992
1.724 bln
+200.137 mln
13.13%
jan 1, 1993
2.578 bln
+853.572 mln
49.5%
jan 1, 1994
2.999 bln
+421.088 mln
16.33%
jan 1, 1995
3.274 bln
+274.802 mln
9.16%
jan 1, 1996
3.675 bln
+400.855 mln
12.24%
jan 1, 1997
3.478 bln
-196.458 mln
-5.35%
jan 1, 1998
3.363 bln
-115.77 mln
-3.33%
jan 1, 1999
2.876 bln
-486.609 mln
-14.47%
jan 1, 2000
2.536 bln
-340.074 mln
-11.82%
jan 1, 2001
2.893 bln
+357.33 mln
14.09%
jan 1, 2002
2.859 bln
-34.676 mln
-1.2%
jan 1, 2003
3.246 bln
+387.592 mln
13.56%
jan 1, 2004
4.005 bln
+758.982 mln
23.38%
jan 1, 2005
6.035 bln
+2.03 bln
50.7%
jan 1, 2006
7.045 bln
+1.01 bln
16.73%
jan 1, 2007
9.196 bln
+2.151 bln
30.53%
jan 1, 2008
11.736 bln
+2.54 bln
27.62%
jan 1, 2009
13.286 bln
+1.551 bln
13.21%
jan 1, 2010
13.378 bln
+91.665 mln
0.69%
jan 1, 2011
19.248 bln
+5.87 bln
43.88%
jan 1, 2012
26.368 bln
+7.12 bln
36.99%
jan 1, 2013
31.302 bln
+4.934 bln
18.71%
jan 1, 2014
38.296 bln
+6.994 bln
22.34%
jan 1, 2015
40.557 bln
+2.261 bln
5.9%
jan 1, 2016
29.933 bln
-10.624 bln
-26.19%
Ranking of countries by current statistics by years


Comments: