29
/
en
AIzaSyAYiBZKx7MnpbEhh9jyipgxe19OcubqV5w
April 1, 2024
211757
Niger
NER
true
2
1
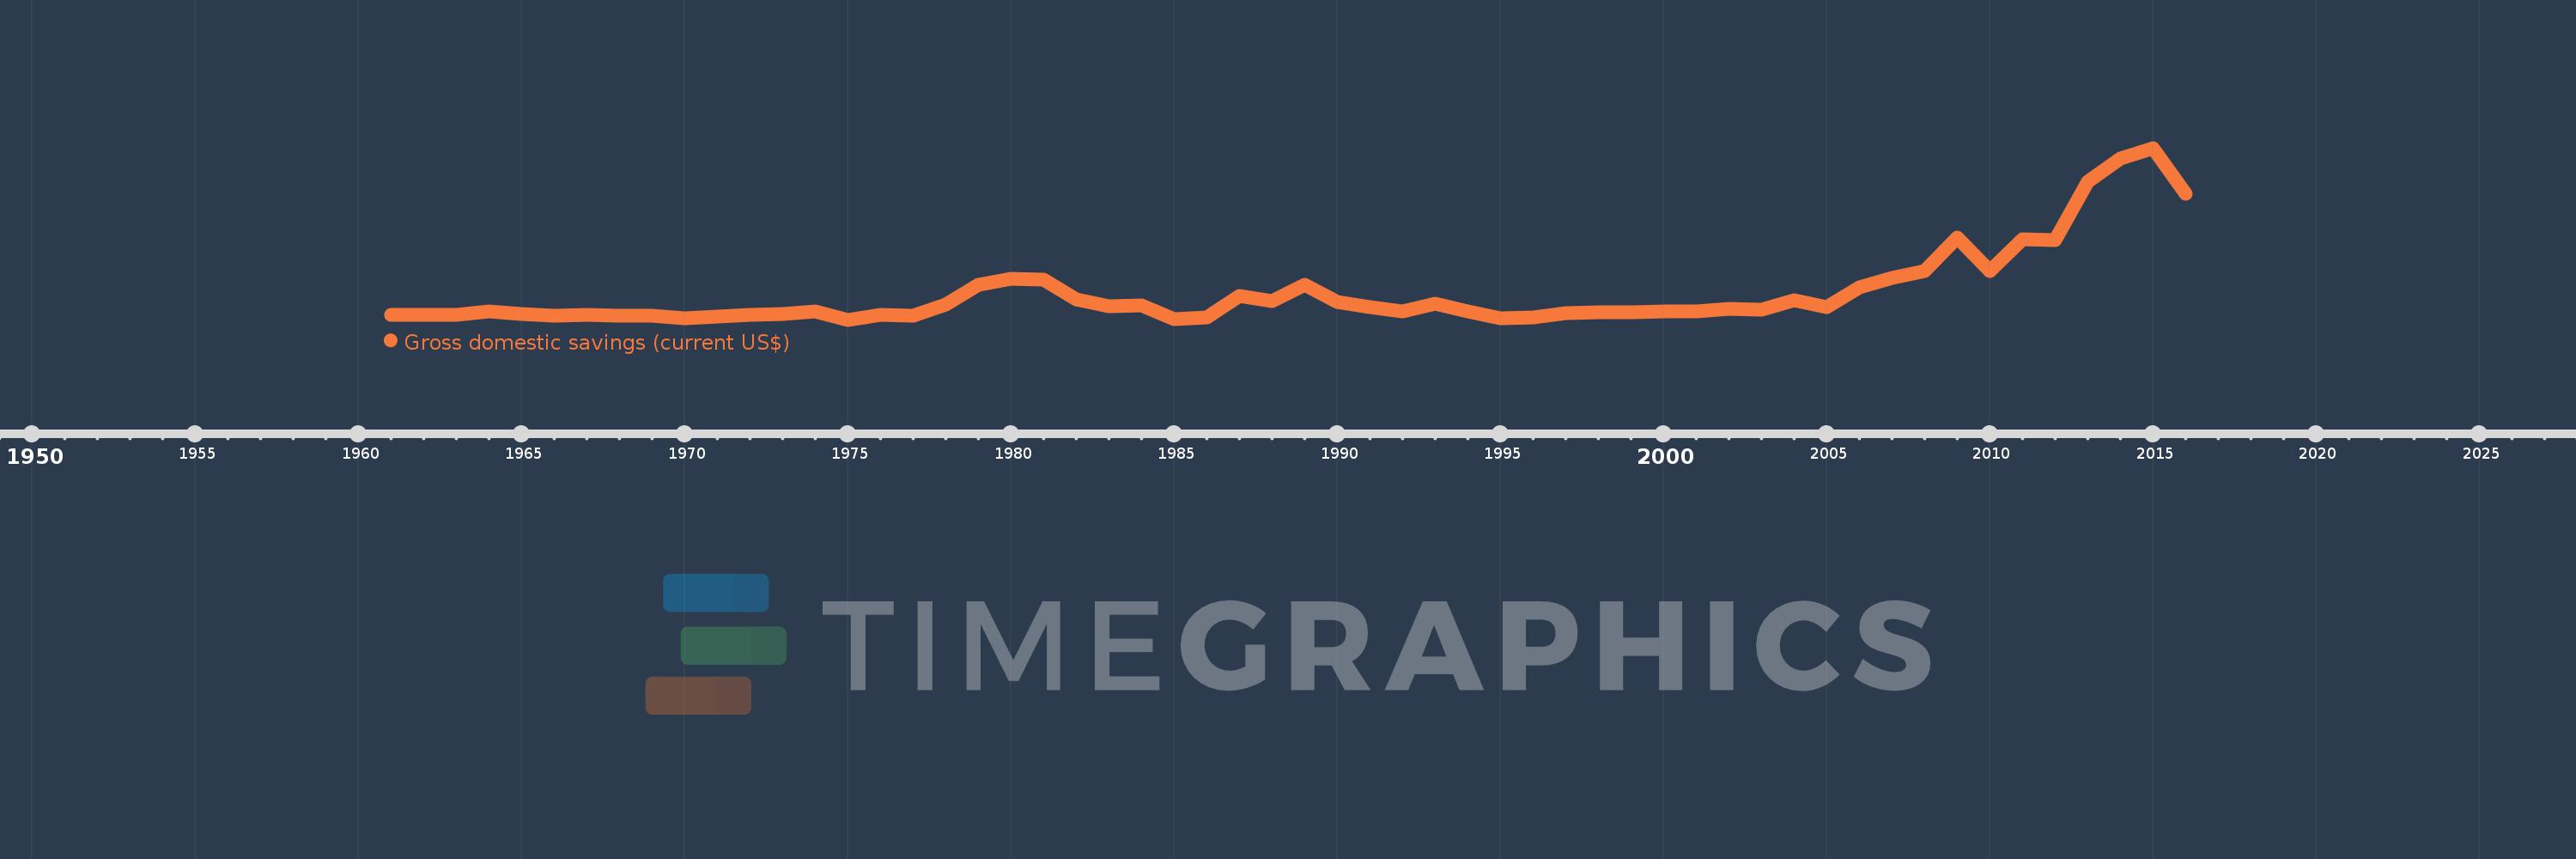
Gross domestic savings (current US$)
2016,2015,2014,2013,2012,2011,2010,2009,2008,2007,2006,2005,2004,2003,2002,2001,2000,1999,1998,1997,1996,1995,1994,1993,1992,1991,1990,1989,1988,1987,1986,1985,1984,1983,1982,1981,1980,1979,1978,1977,1976,1975,1974,1973,1972,1971,1970,1969,1968,1967,1966,1965,1964,1963,1962,1961
This statistics in other country:
AfghanistanAlbaniaAlgeriaAngolaAntigua and BarbudaArab WorldArgentinaArmeniaArubaAustraliaAustriaAzerbaijanBahamas, TheBahrainBangladeshBarbadosBelarusBelgiumBelizeBeninBermudaBhutanBoliviaBosnia and HerzegovinaBotswanaBrazilBrunei DarussalamBulgariaBurkina FasoBurundiCabo VerdeCambodiaCameroonCanadaCaribbean small statesCentral African RepublicCentral Europe and the BalticsChadChileChinaColombiaComorosCongo, Dem. Rep.Congo, Rep.Costa RicaCote d'IvoireCroatiaCubaCyprusCzech RepublicDenmarkDjiboutiDominicaDominican RepublicEarly-demographic dividendEast Asia & PacificEast Asia & Pacific (excluding high income)East Asia & Pacific (IDA & IBRD countries)EcuadorEgypt, Arab Rep.El SalvadorEquatorial GuineaEritreaEstoniaEthiopiaEuro areaEurope & Central AsiaEurope & Central Asia (excluding high income)Europe & Central Asia (IDA & IBRD countries)European UnionFaroe IslandsFijiFinlandFragile and conflict affected situationsFranceGabonGambia, TheGeorgiaGermanyGhanaGreeceGrenadaGuatemalaGuineaGuinea-BissauGuyanaHaitiHeavily indebted poor countries (HIPC)High incomeHondurasHong Kong SAR, ChinaHungaryIBRD onlyIcelandIDA & IBRD totalIDA blendIDA onlyIDA totalIndiaIndonesiaIran, Islamic Rep.IraqIrelandIsraelItalyJamaicaJapanJordanKazakhstanKenyaKiribatiKorea, Rep.KosovoKuwaitKyrgyz RepublicLao PDRLate-demographic dividendLatin America & Caribbean Latin America & Caribbean (excluding high income)Latin America & the Caribbean (IDA & IBRD countries)LatviaLeast developed countries: UN classificationLebanonLesothoLiberiaLibyaLithuaniaLow & middle incomeLow incomeLower middle incomeLuxembourgMacao SAR, ChinaMacedonia, FYRMadagascarMalawiMalaysiaMaldivesMaliMaltaMauritaniaMauritiusMexicoMicronesia, Fed. Sts.Middle East & North AfricaMiddle East & North Africa (excluding high income)Middle East & North Africa (IDA & IBRD countries)Middle incomeMoldovaMongoliaMontenegroMoroccoMozambiqueNamibiaNepalNetherlandsNew CaledoniaNew ZealandNicaraguaNigerNigeriaNorth AmericaNorwayOECD membersOmanOther small statesPakistanPanamaPapua New GuineaParaguayPeruPhilippinesPolandPortugalPost-demographic dividendPre-demographic dividendPuerto RicoQatarRomaniaRussian FederationRwandaSaudi ArabiaSenegalSerbiaSeychellesSierra LeoneSingaporeSlovak RepublicSloveniaSmall statesSolomon IslandsSouth AfricaSouth AsiaSouth Asia (IDA & IBRD)South SudanSpainSri LankaSt. Kitts and NevisSt. LuciaSt. Vincent and the GrenadinesSub-Saharan Africa Sub-Saharan Africa (excluding high income)Sub-Saharan Africa (IDA & IBRD countries)SudanSurinameSwazilandSwedenSwitzerlandSyrian Arab RepublicTajikistanTanzaniaThailandTimor-LesteTogoTongaTrinidad and TobagoTunisiaTurkeyTurkmenistanUgandaUkraineUnited Arab EmiratesUnited KingdomUnited StatesUpper middle incomeUruguayUzbekistanVanuatuVenezuela, RBVietnamWest Bank and GazaWorldYemen, Rep.ZambiaZimbabwe Timeline:
This timeline shows a graph from 1961 to 2016 of Niger. No data until 1960. Number of actual observations by date: 56.
Source name:
World Development Indicators
Source organization:
World Bank national accounts data, and OECD National Accounts data files.
Categories, topics:
Economy & Growth
Last updated:
apr 23, 2017
Indicators value changes by year
Minimum:
-16.903 mln
jan 1, 1975
Maximum:
1.614 bln
jan 1, 2015
At the date of observation
Value
Absolute change
Change from previous value
jan 1, 1961
28.728 mln
+28.728 mln
0.0%
jan 1, 1962
25.867 mln
-2.861 mln
-9.96%
jan 1, 1963
33.034 mln
+7.167 mln
27.71%
jan 1, 1964
66.283 mln
+33.249 mln
100.65%
jan 1, 1965
34.779 mln
-31.504 mln
-47.53%
jan 1, 1966
23.16 mln
-11.619 mln
-33.41%
jan 1, 1967
29.56 mln
+6.4 mln
27.63%
jan 1, 1968
18.124 mln
-11.436 mln
-38.69%
jan 1, 1969
21.678 mln
+3.554 mln
19.61%
jan 1, 1970
-5.587 mln
-27.265 mln
-125.77%
jan 1, 1971
16.387 mln
+21.974 mln
-393.28%
jan 1, 1972
31.525 mln
+15.138 mln
92.38%
jan 1, 1973
35.567 mln
+4.043 mln
12.82%
jan 1, 1974
63.569 mln
+28.002 mln
78.73%
jan 1, 1975
-16.903 mln
-80.472 mln
-126.59%
jan 1, 1976
26.92 mln
+43.823 mln
-259.26%
jan 1, 1977
22.733 mln
-4.187 mln
-15.55%
jan 1, 1978
129.087 mln
+106.354 mln
467.83%
jan 1, 1979
313.983 mln
+184.896 mln
143.23%
jan 1, 1980
369.182 mln
+55.199 mln
17.58%
jan 1, 1981
365.526 mln
-3.656 mln
-0.99%
jan 1, 1982
179.01 mln
-186.516 mln
-51.03%
jan 1, 1983
110.187 mln
-68.823 mln
-38.45%
jan 1, 1984
116.409 mln
+6.222 mln
5.65%
jan 1, 1985
-13.4 mln
-129.81 mln
-111.51%
jan 1, 1986
8.535 mln
+21.936 mln
-163.69%
jan 1, 1987
207.737 mln
+199.202 mln
2.33K%
jan 1, 1988
162.425 mln
-45.312 mln
-21.81%
jan 1, 1989
313.849 mln
+151.423 mln
93.23%
jan 1, 1990
152.111 mln
-161.738 mln
-51.53%
jan 1, 1991
104.803 mln
-47.308 mln
-31.1%
jan 1, 1992
65.168 mln
-39.635 mln
-37.82%
jan 1, 1993
137.044 mln
+71.876 mln
110.29%
jan 1, 1994
63.398 mln
-73.646 mln
-53.74%
jan 1, 1995
706.097K
-62.692 mln
-98.89%
jan 1, 1996
3.796 mln
+3.09 mln
437.67%
jan 1, 1997
46.463 mln
+42.666 mln
1.12K%
jan 1, 1998
56.155 mln
+9.693 mln
20.86%
jan 1, 1999
56.552 mln
+397.008K
0.71%
jan 1, 2000
58.283 mln
+1.731 mln
3.06%
jan 1, 2001
63.69 mln
+5.407 mln
9.28%
jan 1, 2002
86.213 mln
+22.523 mln
35.36%
jan 1, 2003
78.214 mln
-8.0 mln
-9.28%
jan 1, 2004
169.279 mln
+91.066 mln
116.43%
jan 1, 2005
100.932 mln
-68.347 mln
-40.38%
jan 1, 2006
294.308 mln
+193.376 mln
191.59%
jan 1, 2007
382.435 mln
+88.127 mln
29.94%
jan 1, 2008
446.363 mln
+63.928 mln
16.72%
jan 1, 2009
763.736 mln
+317.373 mln
71.1%
jan 1, 2010
442.746 mln
-320.99 mln
-42.03%
jan 1, 2011
746.727 mln
+303.981 mln
68.66%
jan 1, 2012
737.701 mln
-9.026 mln
-1.21%
jan 1, 2013
1.296 bln
+558.787 mln
75.75%
jan 1, 2014
1.511 bln
+214.513 mln
16.55%
jan 1, 2015
1.614 bln
+103.355 mln
6.84%
jan 1, 2016
1.183 bln
-430.981 mln
-26.7%
Ranking of countries by current statistics by years


Comments: