29
/
en
AIzaSyAYiBZKx7MnpbEhh9jyipgxe19OcubqV5w
April 1, 2024
164891
Jordan
JOR
true
2
1
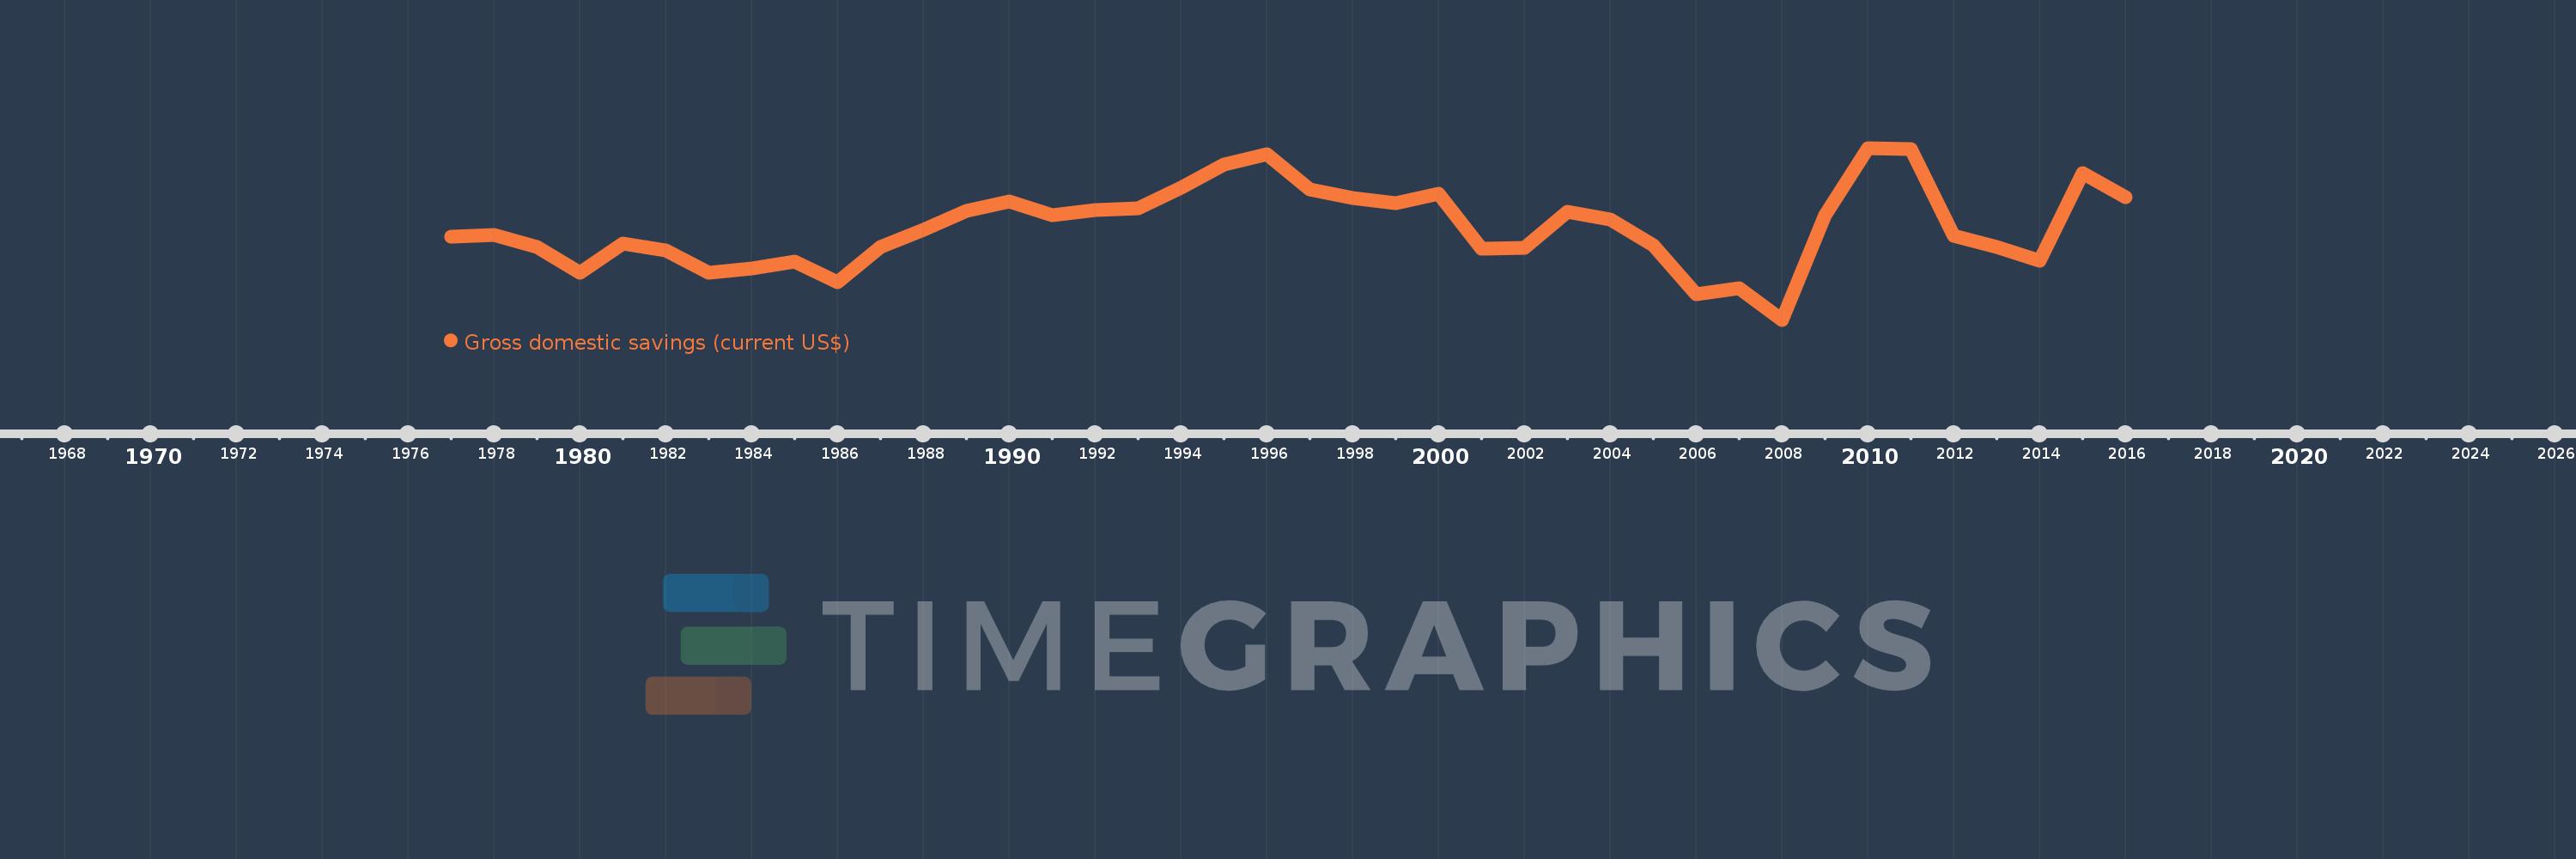
Gross domestic savings (current US$)
2016,2015,2014,2013,2012,2011,2010,2009,2008,2007,2006,2005,2004,2003,2002,2001,2000,1999,1998,1997,1996,1995,1994,1993,1992,1991,1990,1989,1988,1987,1986,1985,1984,1983,1982,1981,1980,1979,1978,1977
This statistics in other country:
AfghanistanAlbaniaAlgeriaAngolaAntigua and BarbudaArab WorldArgentinaArmeniaArubaAustraliaAustriaAzerbaijanBahamas, TheBahrainBangladeshBarbadosBelarusBelgiumBelizeBeninBermudaBhutanBoliviaBosnia and HerzegovinaBotswanaBrazilBrunei DarussalamBulgariaBurkina FasoBurundiCabo VerdeCambodiaCameroonCanadaCaribbean small statesCentral African RepublicCentral Europe and the BalticsChadChileChinaColombiaComorosCongo, Dem. Rep.Congo, Rep.Costa RicaCote d'IvoireCroatiaCubaCyprusCzech RepublicDenmarkDjiboutiDominicaDominican RepublicEarly-demographic dividendEast Asia & PacificEast Asia & Pacific (excluding high income)East Asia & Pacific (IDA & IBRD countries)EcuadorEgypt, Arab Rep.El SalvadorEquatorial GuineaEritreaEstoniaEthiopiaEuro areaEurope & Central AsiaEurope & Central Asia (excluding high income)Europe & Central Asia (IDA & IBRD countries)European UnionFaroe IslandsFijiFinlandFragile and conflict affected situationsFranceGabonGambia, TheGeorgiaGermanyGhanaGreeceGrenadaGuatemalaGuineaGuinea-BissauGuyanaHaitiHeavily indebted poor countries (HIPC)High incomeHondurasHong Kong SAR, ChinaHungaryIBRD onlyIcelandIDA & IBRD totalIDA blendIDA onlyIDA totalIndiaIndonesiaIran, Islamic Rep.IraqIrelandIsraelItalyJamaicaJapanJordanKazakhstanKenyaKiribatiKorea, Rep.KosovoKuwaitKyrgyz RepublicLao PDRLate-demographic dividendLatin America & Caribbean Latin America & Caribbean (excluding high income)Latin America & the Caribbean (IDA & IBRD countries)LatviaLeast developed countries: UN classificationLebanonLesothoLiberiaLibyaLithuaniaLow & middle incomeLow incomeLower middle incomeLuxembourgMacao SAR, ChinaMacedonia, FYRMadagascarMalawiMalaysiaMaldivesMaliMaltaMauritaniaMauritiusMexicoMicronesia, Fed. Sts.Middle East & North AfricaMiddle East & North Africa (excluding high income)Middle East & North Africa (IDA & IBRD countries)Middle incomeMoldovaMongoliaMontenegroMoroccoMozambiqueNamibiaNepalNetherlandsNew CaledoniaNew ZealandNicaraguaNigerNigeriaNorth AmericaNorwayOECD membersOmanOther small statesPakistanPanamaPapua New GuineaParaguayPeruPhilippinesPolandPortugalPost-demographic dividendPre-demographic dividendPuerto RicoQatarRomaniaRussian FederationRwandaSaudi ArabiaSenegalSerbiaSeychellesSierra LeoneSingaporeSlovak RepublicSloveniaSmall statesSolomon IslandsSouth AfricaSouth AsiaSouth Asia (IDA & IBRD)South SudanSpainSri LankaSt. Kitts and NevisSt. LuciaSt. Vincent and the GrenadinesSub-Saharan Africa Sub-Saharan Africa (excluding high income)Sub-Saharan Africa (IDA & IBRD countries)SudanSurinameSwazilandSwedenSwitzerlandSyrian Arab RepublicTajikistanTanzaniaThailandTimor-LesteTogoTongaTrinidad and TobagoTunisiaTurkeyTurkmenistanUgandaUkraineUnited Arab EmiratesUnited KingdomUnited StatesUpper middle incomeUruguayUzbekistanVanuatuVenezuela, RBVietnamWest Bank and GazaWorldYemen, Rep.ZambiaZimbabwe Timeline:
This timeline shows a graph from 1977 to 2016 of Jordan. No data until 1976. Number of actual observations by date: 40.
Source name:
World Development Indicators
Source organization:
World Bank national accounts data, and OECD National Accounts data files.
Categories, topics:
Economy & Growth
Last updated:
apr 23, 2017
Indicators value changes by year
Minimum:
-1.242 bln
jan 1, 2008
Maximum:
867.183 mln
jan 1, 2010
At the date of observation
Value
Absolute change
Change from previous value
jan 1, 1977
-227.108 mln
-227.108 mln
0.0%
jan 1, 1978
-199.818 mln
+27.291 mln
-12.02%
jan 1, 1979
-345.877 mln
-146.059 mln
73.1%
jan 1, 1980
-669.664 mln
-323.787 mln
93.61%
jan 1, 1981
-302.786 mln
+366.877 mln
-54.79%
jan 1, 1982
-388.923 mln
-86.136 mln
28.45%
jan 1, 1983
-665.816 mln
-276.893 mln
71.19%
jan 1, 1984
-616.359 mln
+49.456 mln
-7.43%
jan 1, 1985
-524.317 mln
+92.042 mln
-14.93%
jan 1, 1986
-776.318 mln
-252.0 mln
48.06%
jan 1, 1987
-345.763 mln
+430.555 mln
-55.46%
jan 1, 1988
-141.299 mln
+204.464 mln
-59.13%
jan 1, 1989
89.647 mln
+230.946 mln
-163.45%
jan 1, 1990
206.326 mln
+116.679 mln
130.15%
jan 1, 1991
42.33 mln
-163.996 mln
-79.48%
jan 1, 1992
107.945 mln
+65.615 mln
155.01%
jan 1, 1993
122.095 mln
+14.149 mln
13.11%
jan 1, 1994
381.826 mln
+259.731 mln
212.73%
jan 1, 1995
666.582 mln
+284.757 mln
74.58%
jan 1, 1996
795.377 mln
+128.794 mln
19.32%
jan 1, 1997
362.059 mln
-433.317 mln
-54.48%
jan 1, 1998
250.776 mln
-111.283 mln
-30.74%
jan 1, 1999
184.768 mln
-66.008 mln
-26.32%
jan 1, 2000
301.525 mln
+116.758 mln
63.19%
jan 1, 2001
-364.915 mln
-666.44 mln
-221.02%
jan 1, 2002
-355.439 mln
+9.476 mln
-2.6%
jan 1, 2003
86.236 mln
+441.675 mln
-124.26%
jan 1, 2004
-12.394 mln
-98.631 mln
-114.37%
jan 1, 2005
-326.221 mln
-313.827 mln
2.53K%
jan 1, 2006
-925.479 mln
-599.258 mln
183.7%
jan 1, 2007
-852.045 mln
+73.434 mln
-7.93%
jan 1, 2008
-1.242 bln
-389.563 mln
45.72%
jan 1, 2009
39.876 mln
+1.281 bln
-103.21%
jan 1, 2010
867.183 mln
+827.307 mln
2.07K%
jan 1, 2011
850.753 mln
-16.43 mln
-1.89%
jan 1, 2012
-216.311 mln
-1.067 bln
-125.43%
jan 1, 2013
-346.761 mln
-130.45 mln
60.31%
jan 1, 2014
-519.361 mln
-172.6 mln
49.77%
jan 1, 2015
560.76 mln
+1.08 bln
-207.97%
jan 1, 2016
266.049 mln
-294.711 mln
-52.56%
Ranking of countries by current statistics by years


Comments: