29
/
en
AIzaSyAYiBZKx7MnpbEhh9jyipgxe19OcubqV5w
April 1, 2024
82833
Belize
BLZ
true
2
1
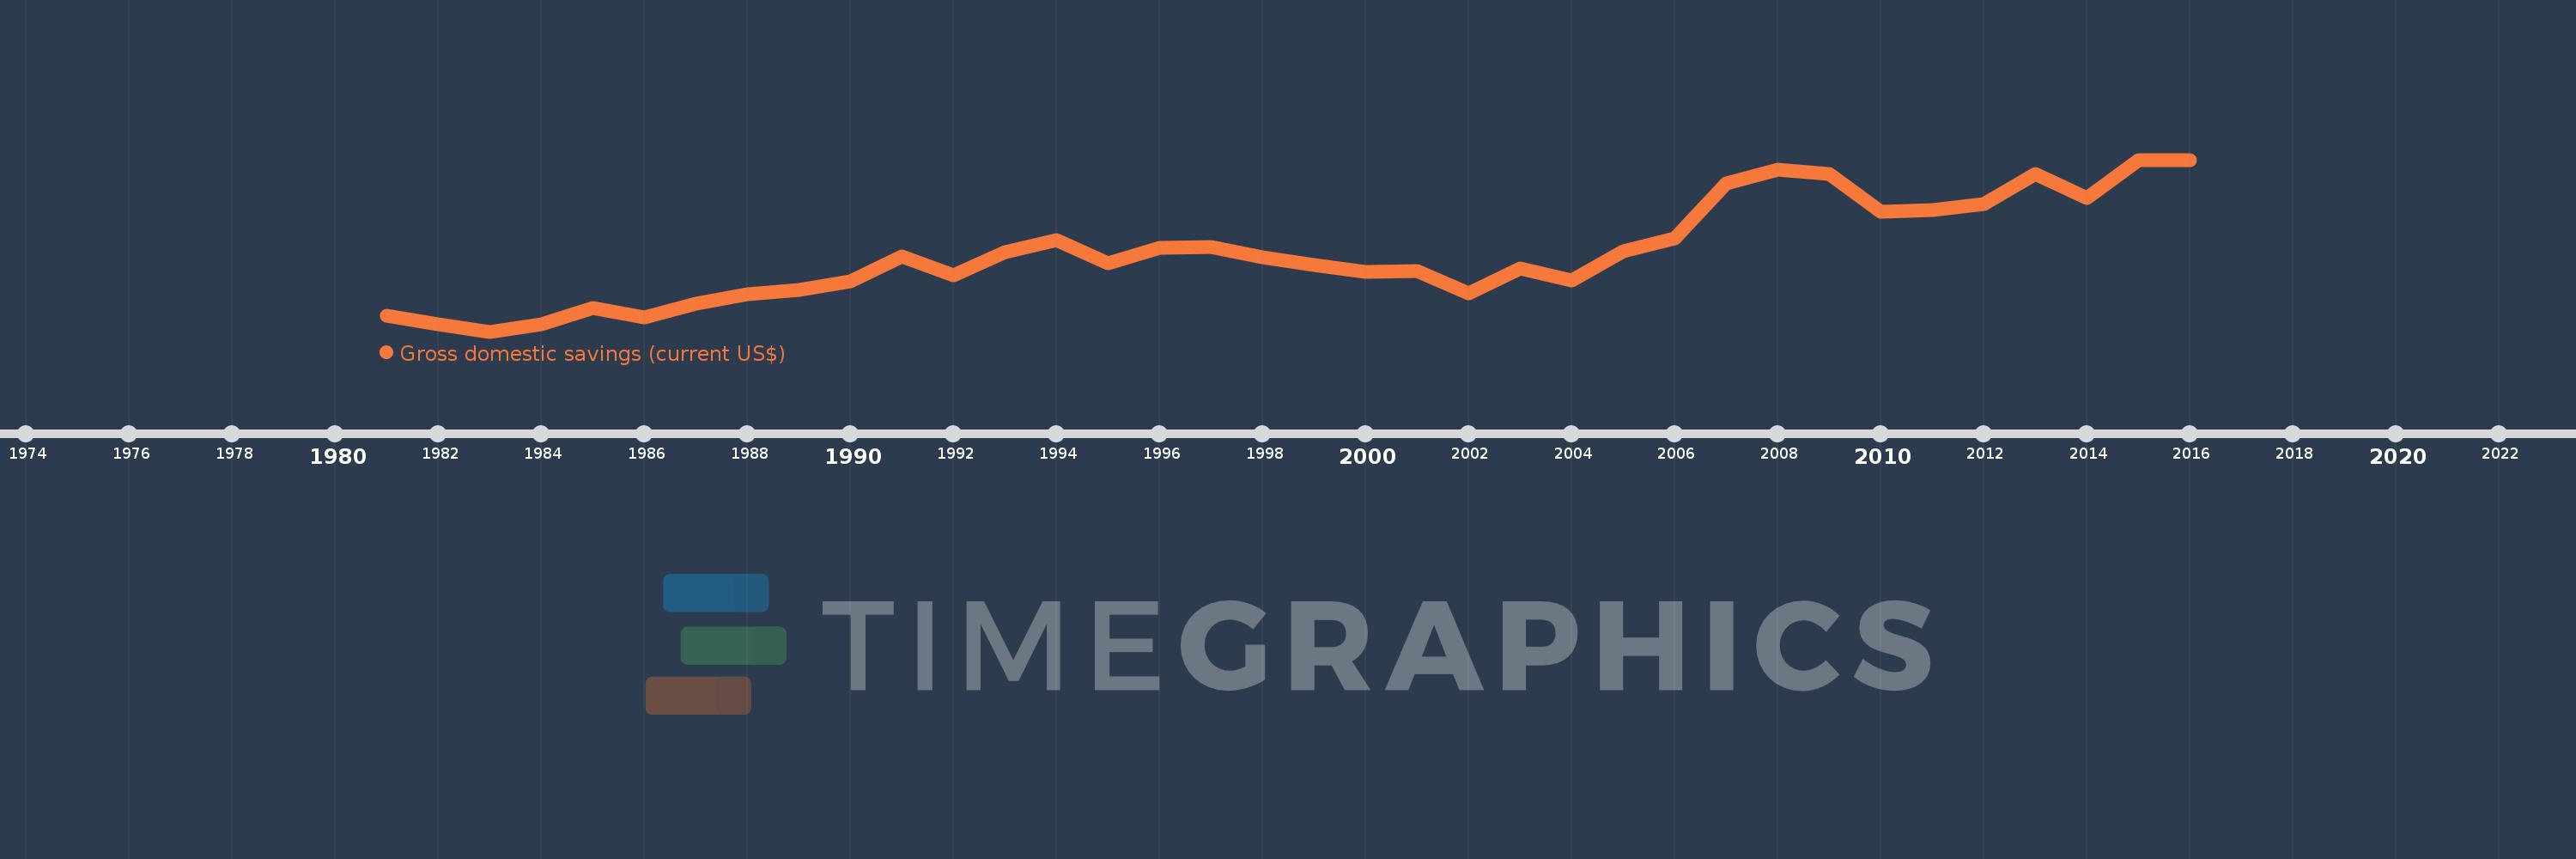
Gross domestic savings (current US$)
2016,2015,2014,2013,2012,2011,2010,2009,2008,2007,2006,2005,2004,2003,2002,2001,2000,1999,1998,1997,1996,1995,1994,1993,1992,1991,1990,1989,1988,1987,1986,1985,1984,1983,1982,1981
This statistics in other country:
AfghanistanAlbaniaAlgeriaAngolaAntigua and BarbudaArab WorldArgentinaArmeniaArubaAustraliaAustriaAzerbaijanBahamas, TheBahrainBangladeshBarbadosBelarusBelgiumBelizeBeninBermudaBhutanBoliviaBosnia and HerzegovinaBotswanaBrazilBrunei DarussalamBulgariaBurkina FasoBurundiCabo VerdeCambodiaCameroonCanadaCaribbean small statesCentral African RepublicCentral Europe and the BalticsChadChileChinaColombiaComorosCongo, Dem. Rep.Congo, Rep.Costa RicaCote d'IvoireCroatiaCubaCyprusCzech RepublicDenmarkDjiboutiDominicaDominican RepublicEarly-demographic dividendEast Asia & PacificEast Asia & Pacific (excluding high income)East Asia & Pacific (IDA & IBRD countries)EcuadorEgypt, Arab Rep.El SalvadorEquatorial GuineaEritreaEstoniaEthiopiaEuro areaEurope & Central AsiaEurope & Central Asia (excluding high income)Europe & Central Asia (IDA & IBRD countries)European UnionFaroe IslandsFijiFinlandFragile and conflict affected situationsFranceGabonGambia, TheGeorgiaGermanyGhanaGreeceGrenadaGuatemalaGuineaGuinea-BissauGuyanaHaitiHeavily indebted poor countries (HIPC)High incomeHondurasHong Kong SAR, ChinaHungaryIBRD onlyIcelandIDA & IBRD totalIDA blendIDA onlyIDA totalIndiaIndonesiaIran, Islamic Rep.IraqIrelandIsraelItalyJamaicaJapanJordanKazakhstanKenyaKiribatiKorea, Rep.KosovoKuwaitKyrgyz RepublicLao PDRLate-demographic dividendLatin America & Caribbean Latin America & Caribbean (excluding high income)Latin America & the Caribbean (IDA & IBRD countries)LatviaLeast developed countries: UN classificationLebanonLesothoLiberiaLibyaLithuaniaLow & middle incomeLow incomeLower middle incomeLuxembourgMacao SAR, ChinaMacedonia, FYRMadagascarMalawiMalaysiaMaldivesMaliMaltaMauritaniaMauritiusMexicoMicronesia, Fed. Sts.Middle East & North AfricaMiddle East & North Africa (excluding high income)Middle East & North Africa (IDA & IBRD countries)Middle incomeMoldovaMongoliaMontenegroMoroccoMozambiqueNamibiaNepalNetherlandsNew CaledoniaNew ZealandNicaraguaNigerNigeriaNorth AmericaNorwayOECD membersOmanOther small statesPakistanPanamaPapua New GuineaParaguayPeruPhilippinesPolandPortugalPost-demographic dividendPre-demographic dividendPuerto RicoQatarRomaniaRussian FederationRwandaSaudi ArabiaSenegalSerbiaSeychellesSierra LeoneSingaporeSlovak RepublicSloveniaSmall statesSolomon IslandsSouth AfricaSouth AsiaSouth Asia (IDA & IBRD)South SudanSpainSri LankaSt. Kitts and NevisSt. LuciaSt. Vincent and the GrenadinesSub-Saharan Africa Sub-Saharan Africa (excluding high income)Sub-Saharan Africa (IDA & IBRD countries)SudanSurinameSwazilandSwedenSwitzerlandSyrian Arab RepublicTajikistanTanzaniaThailandTimor-LesteTogoTongaTrinidad and TobagoTunisiaTurkeyTurkmenistanUgandaUkraineUnited Arab EmiratesUnited KingdomUnited StatesUpper middle incomeUruguayUzbekistanVanuatuVenezuela, RBVietnamWest Bank and GazaWorldYemen, Rep.ZambiaZimbabwe Timeline:
This timeline shows a graph from 1981 to 2016 of Belize. No data until 1980. Number of actual observations by date: 36.
Source name:
World Development Indicators
Source organization:
World Bank national accounts data, and OECD National Accounts data files.
Categories, topics:
Economy & Growth
Last updated:
apr 23, 2017
Indicators value changes by year
Minimum:
-3.3 mln
jan 1, 1983
Maximum:
266.358 mln
jan 1, 2016
At the date of observation
Value
Absolute change
Change from previous value
jan 1, 1981
21.25 mln
+21.25 mln
0.0%
jan 1, 1982
7.9 mln
-13.35 mln
-62.82%
jan 1, 1983
-3.3 mln
-11.2 mln
-141.77%
jan 1, 1984
8.1 mln
+11.4 mln
-345.45%
jan 1, 1985
33.4 mln
+25.3 mln
312.35%
jan 1, 1986
18.4 mln
-15.0 mln
-44.91%
jan 1, 1987
40.45 mln
+22.05 mln
119.84%
jan 1, 1988
54.75 mln
+14.3 mln
35.35%
jan 1, 1989
61.55 mln
+6.8 mln
12.42%
jan 1, 1990
75.9 mln
+14.35 mln
23.31%
jan 1, 1991
114.85 mln
+38.95 mln
51.32%
jan 1, 1992
84.45 mln
-30.4 mln
-26.47%
jan 1, 1993
121.418 mln
+36.968 mln
43.77%
jan 1, 1994
139.891 mln
+18.473 mln
15.21%
jan 1, 1995
104.24 mln
-35.651 mln
-25.48%
jan 1, 1996
127.484 mln
+23.244 mln
22.3%
jan 1, 1997
128.853 mln
+1.368 mln
1.07%
jan 1, 1998
112.822 mln
-16.03 mln
-12.44%
jan 1, 1999
101.442 mln
-11.38 mln
-10.09%
jan 1, 2000
90.047 mln
-11.395 mln
-11.23%
jan 1, 2001
91.592 mln
+1.545 mln
1.72%
jan 1, 2002
57.156 mln
-34.435 mln
-37.6%
jan 1, 2003
95.699 mln
+38.542 mln
67.43%
jan 1, 2004
76.675 mln
-19.024 mln
-19.88%
jan 1, 2005
122.708 mln
+46.033 mln
60.04%
jan 1, 2006
143.583 mln
+20.875 mln
17.01%
jan 1, 2007
228.784 mln
+85.201 mln
59.34%
jan 1, 2008
251.489 mln
+22.705 mln
9.92%
jan 1, 2009
244.044 mln
-7.445 mln
-2.96%
jan 1, 2010
184.734 mln
-59.31 mln
-24.3%
jan 1, 2011
186.867 mln
+2.133 mln
1.15%
jan 1, 2012
197.067 mln
+10.2 mln
5.46%
jan 1, 2013
244.082 mln
+47.015 mln
23.86%
jan 1, 2014
206.076 mln
-38.006 mln
-15.57%
jan 1, 2015
265.376 mln
+59.299 mln
28.78%
jan 1, 2016
266.358 mln
+981.868K
0.37%
Ranking of countries by current statistics by years


Comments: