29
/
en
AIzaSyAYiBZKx7MnpbEhh9jyipgxe19OcubqV5w
April 1, 2024
219623
Papua New Guinea
PNG
true
2
1
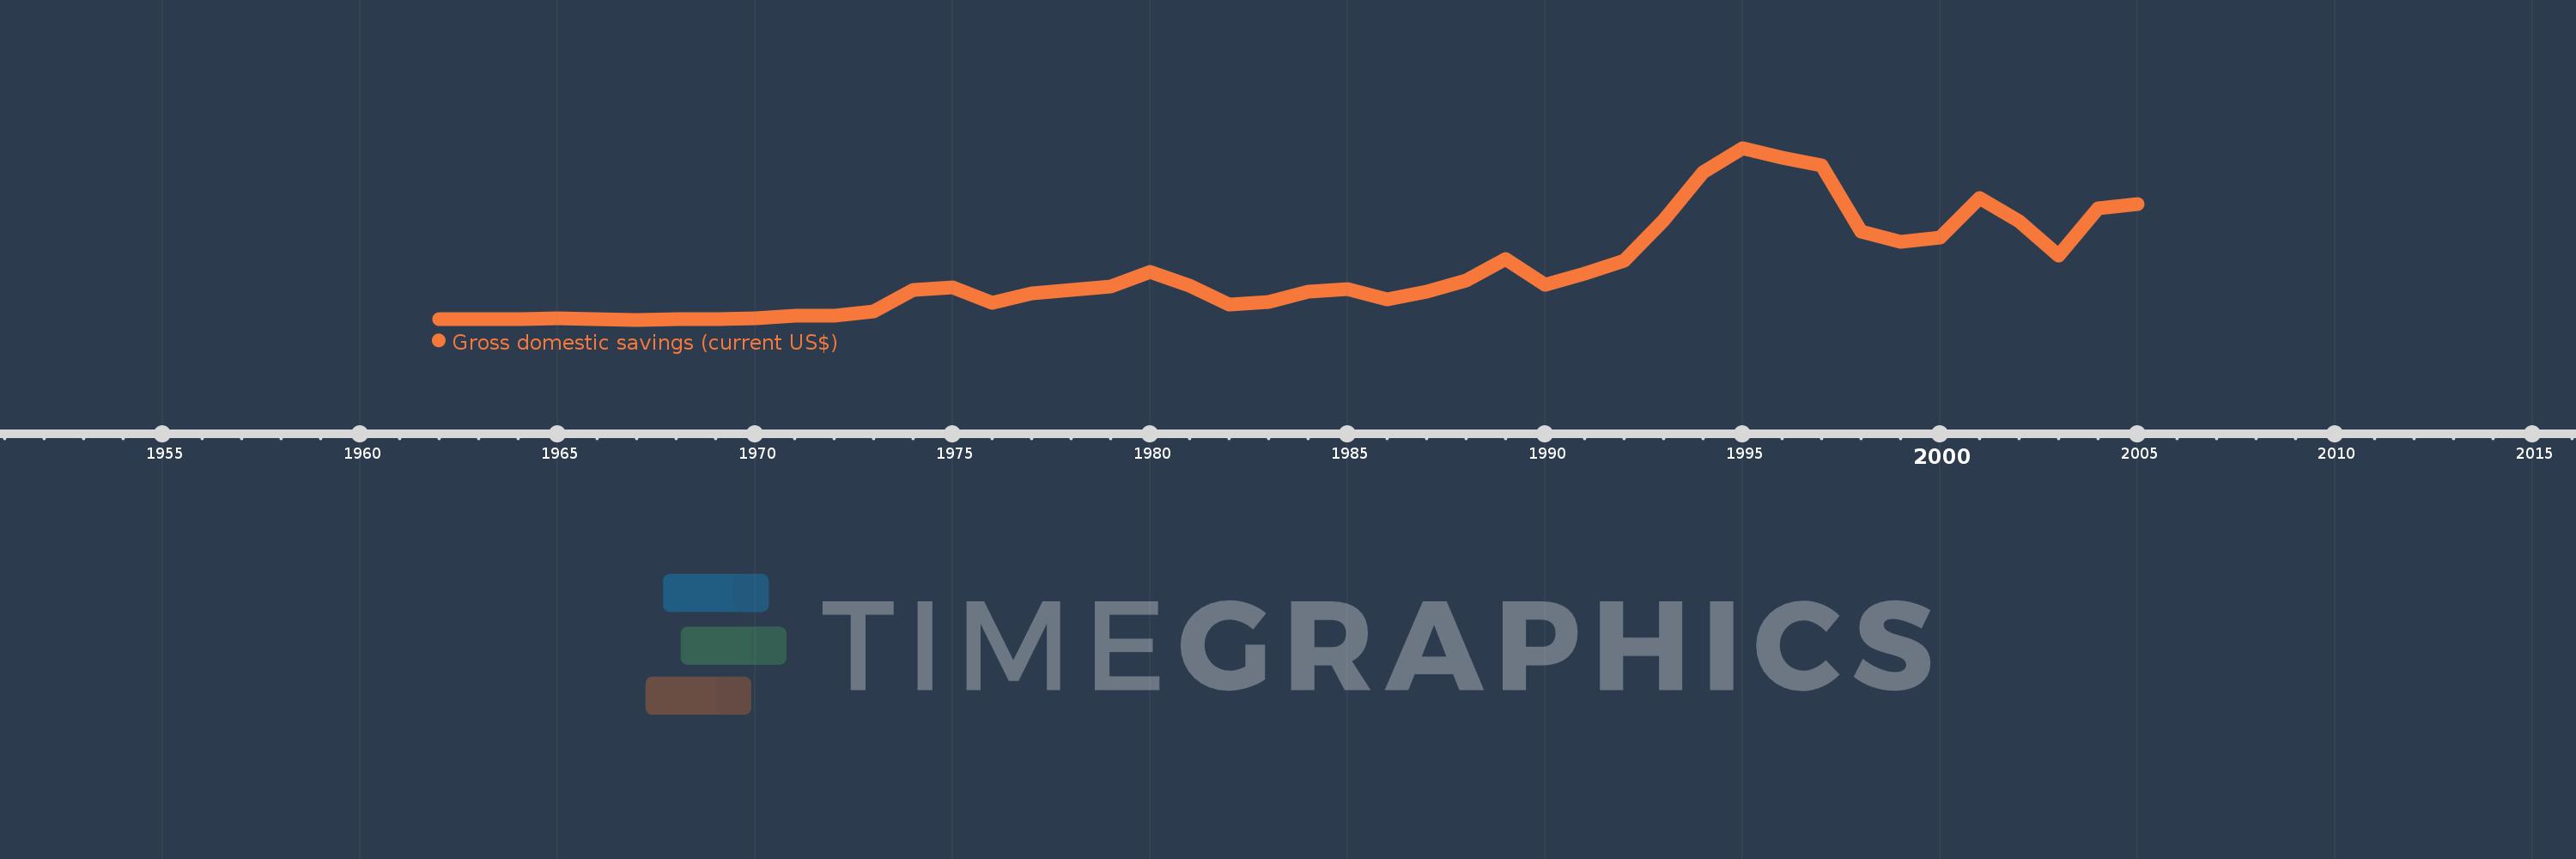
Gross domestic savings (current US$)
2005,2004,2003,2002,2001,2000,1999,1998,1997,1996,1995,1994,1993,1992,1991,1990,1989,1988,1987,1986,1985,1984,1983,1982,1981,1980,1979,1978,1977,1976,1975,1974,1973,1972,1971,1970,1969,1968,1967,1966,1965,1964,1963,1962
This statistics in other country:
AfghanistanAlbaniaAlgeriaAngolaAntigua and BarbudaArab WorldArgentinaArmeniaArubaAustraliaAustriaAzerbaijanBahamas, TheBahrainBangladeshBarbadosBelarusBelgiumBelizeBeninBermudaBhutanBoliviaBosnia and HerzegovinaBotswanaBrazilBrunei DarussalamBulgariaBurkina FasoBurundiCabo VerdeCambodiaCameroonCanadaCaribbean small statesCentral African RepublicCentral Europe and the BalticsChadChileChinaColombiaComorosCongo, Dem. Rep.Congo, Rep.Costa RicaCote d'IvoireCroatiaCubaCyprusCzech RepublicDenmarkDjiboutiDominicaDominican RepublicEarly-demographic dividendEast Asia & PacificEast Asia & Pacific (excluding high income)East Asia & Pacific (IDA & IBRD countries)EcuadorEgypt, Arab Rep.El SalvadorEquatorial GuineaEritreaEstoniaEthiopiaEuro areaEurope & Central AsiaEurope & Central Asia (excluding high income)Europe & Central Asia (IDA & IBRD countries)European UnionFaroe IslandsFijiFinlandFragile and conflict affected situationsFranceGabonGambia, TheGeorgiaGermanyGhanaGreeceGrenadaGuatemalaGuineaGuinea-BissauGuyanaHaitiHeavily indebted poor countries (HIPC)High incomeHondurasHong Kong SAR, ChinaHungaryIBRD onlyIcelandIDA & IBRD totalIDA blendIDA onlyIDA totalIndiaIndonesiaIran, Islamic Rep.IraqIrelandIsraelItalyJamaicaJapanJordanKazakhstanKenyaKiribatiKorea, Rep.KosovoKuwaitKyrgyz RepublicLao PDRLate-demographic dividendLatin America & Caribbean Latin America & Caribbean (excluding high income)Latin America & the Caribbean (IDA & IBRD countries)LatviaLeast developed countries: UN classificationLebanonLesothoLiberiaLibyaLithuaniaLow & middle incomeLow incomeLower middle incomeLuxembourgMacao SAR, ChinaMacedonia, FYRMadagascarMalawiMalaysiaMaldivesMaliMaltaMauritaniaMauritiusMexicoMicronesia, Fed. Sts.Middle East & North AfricaMiddle East & North Africa (excluding high income)Middle East & North Africa (IDA & IBRD countries)Middle incomeMoldovaMongoliaMontenegroMoroccoMozambiqueNamibiaNepalNetherlandsNew CaledoniaNew ZealandNicaraguaNigerNigeriaNorth AmericaNorwayOECD membersOmanOther small statesPakistanPanamaPapua New GuineaParaguayPeruPhilippinesPolandPortugalPost-demographic dividendPre-demographic dividendPuerto RicoQatarRomaniaRussian FederationRwandaSaudi ArabiaSenegalSerbiaSeychellesSierra LeoneSingaporeSlovak RepublicSloveniaSmall statesSolomon IslandsSouth AfricaSouth AsiaSouth Asia (IDA & IBRD)South SudanSpainSri LankaSt. Kitts and NevisSt. LuciaSt. Vincent and the GrenadinesSub-Saharan Africa Sub-Saharan Africa (excluding high income)Sub-Saharan Africa (IDA & IBRD countries)SudanSurinameSwazilandSwedenSwitzerlandSyrian Arab RepublicTajikistanTanzaniaThailandTimor-LesteTogoTongaTrinidad and TobagoTunisiaTurkeyTurkmenistanUgandaUkraineUnited Arab EmiratesUnited KingdomUnited StatesUpper middle incomeUruguayUzbekistanVanuatuVenezuela, RBVietnamWest Bank and GazaWorldYemen, Rep.ZambiaZimbabwe Timeline:
This timeline shows a graph from 1962 to 2005 of Papua New Guinea. No data until 1961. Number of actual observations by date: 44.
Source name:
World Development Indicators
Source organization:
World Bank national accounts data, and OECD National Accounts data files.
Categories, topics:
Economy & Growth
Last updated:
apr 23, 2017
Indicators value changes by year
Minimum:
-3.696 mln
jan 1, 1967
Maximum:
1.933 bln
jan 1, 1995
At the date of observation
Value
Absolute change
Change from previous value
jan 1, 1962
2.688 mln
+2.688 mln
0.0%
jan 1, 1963
3.92 mln
+1.232 mln
45.83%
jan 1, 1964
6.944 mln
+3.024 mln
77.14%
jan 1, 1965
9.52 mln
+2.576 mln
37.1%
jan 1, 1966
5.712 mln
-3.808 mln
-40.0%
jan 1, 1967
-3.696 mln
-9.408 mln
-164.71%
jan 1, 1968
-1.456 mln
+2.24 mln
-60.61%
jan 1, 1969
2.464 mln
+3.92 mln
-269.23%
jan 1, 1970
11.423 mln
+8.96 mln
363.64%
jan 1, 1971
39.646 mln
+28.223 mln
247.06%
jan 1, 1972
42.252 mln
+2.606 mln
6.57%
jan 1, 1973
92.694 mln
+50.443 mln
119.39%
jan 1, 1974
331.771 mln
+239.077 mln
257.92%
jan 1, 1975
358.978 mln
+27.207 mln
8.2%
jan 1, 1976
187.983 mln
-170.995 mln
-47.63%
jan 1, 1977
296.922 mln
+108.939 mln
57.95%
jan 1, 1978
333.207 mln
+36.285 mln
12.22%
jan 1, 1979
372.831 mln
+39.624 mln
11.89%
jan 1, 1980
535.965 mln
+163.134 mln
43.76%
jan 1, 1981
383.664 mln
-152.302 mln
-28.42%
jan 1, 1982
168.499 mln
-215.164 mln
-56.08%
jan 1, 1983
201.219 mln
+32.72 mln
19.42%
jan 1, 1984
312.163 mln
+110.945 mln
55.14%
jan 1, 1985
339.305 mln
+27.142 mln
8.69%
jan 1, 1986
230.331 mln
-108.974 mln
-32.12%
jan 1, 1987
316.759 mln
+86.428 mln
37.52%
jan 1, 1988
440.137 mln
+123.377 mln
38.95%
jan 1, 1989
677.661 mln
+237.524 mln
53.97%
jan 1, 1990
394.504 mln
-283.157 mln
-41.78%
jan 1, 1991
519.038 mln
+124.534 mln
31.57%
jan 1, 1992
663.333 mln
+144.295 mln
27.8%
jan 1, 1993
1.114 bln
+450.912 mln
67.98%
jan 1, 1994
1.658 bln
+543.908 mln
48.81%
jan 1, 1995
1.933 bln
+275.099 mln
16.59%
jan 1, 1996
1.821 bln
-112.317 mln
-5.81%
jan 1, 1997
1.74 bln
-80.897 mln
-4.44%
jan 1, 1998
995.449 mln
-744.588 mln
-42.79%
jan 1, 1999
876.447 mln
-119.002 mln
-11.95%
jan 1, 2000
924.838 mln
+48.391 mln
5.52%
jan 1, 2001
1.367 bln
+442.393 mln
47.83%
jan 1, 2002
1.11 bln
-257.09 mln
-18.8%
jan 1, 2003
723.025 mln
-387.115 mln
-34.87%
jan 1, 2004
1.249 bln
+525.64 mln
72.7%
jan 1, 2005
1.306 bln
+56.963 mln
4.56%
Ranking of countries by current statistics by years


Comments: