29
/
en
AIzaSyAYiBZKx7MnpbEhh9jyipgxe19OcubqV5w
April 1, 2024
79502
Barbados
BRB
true
2
1
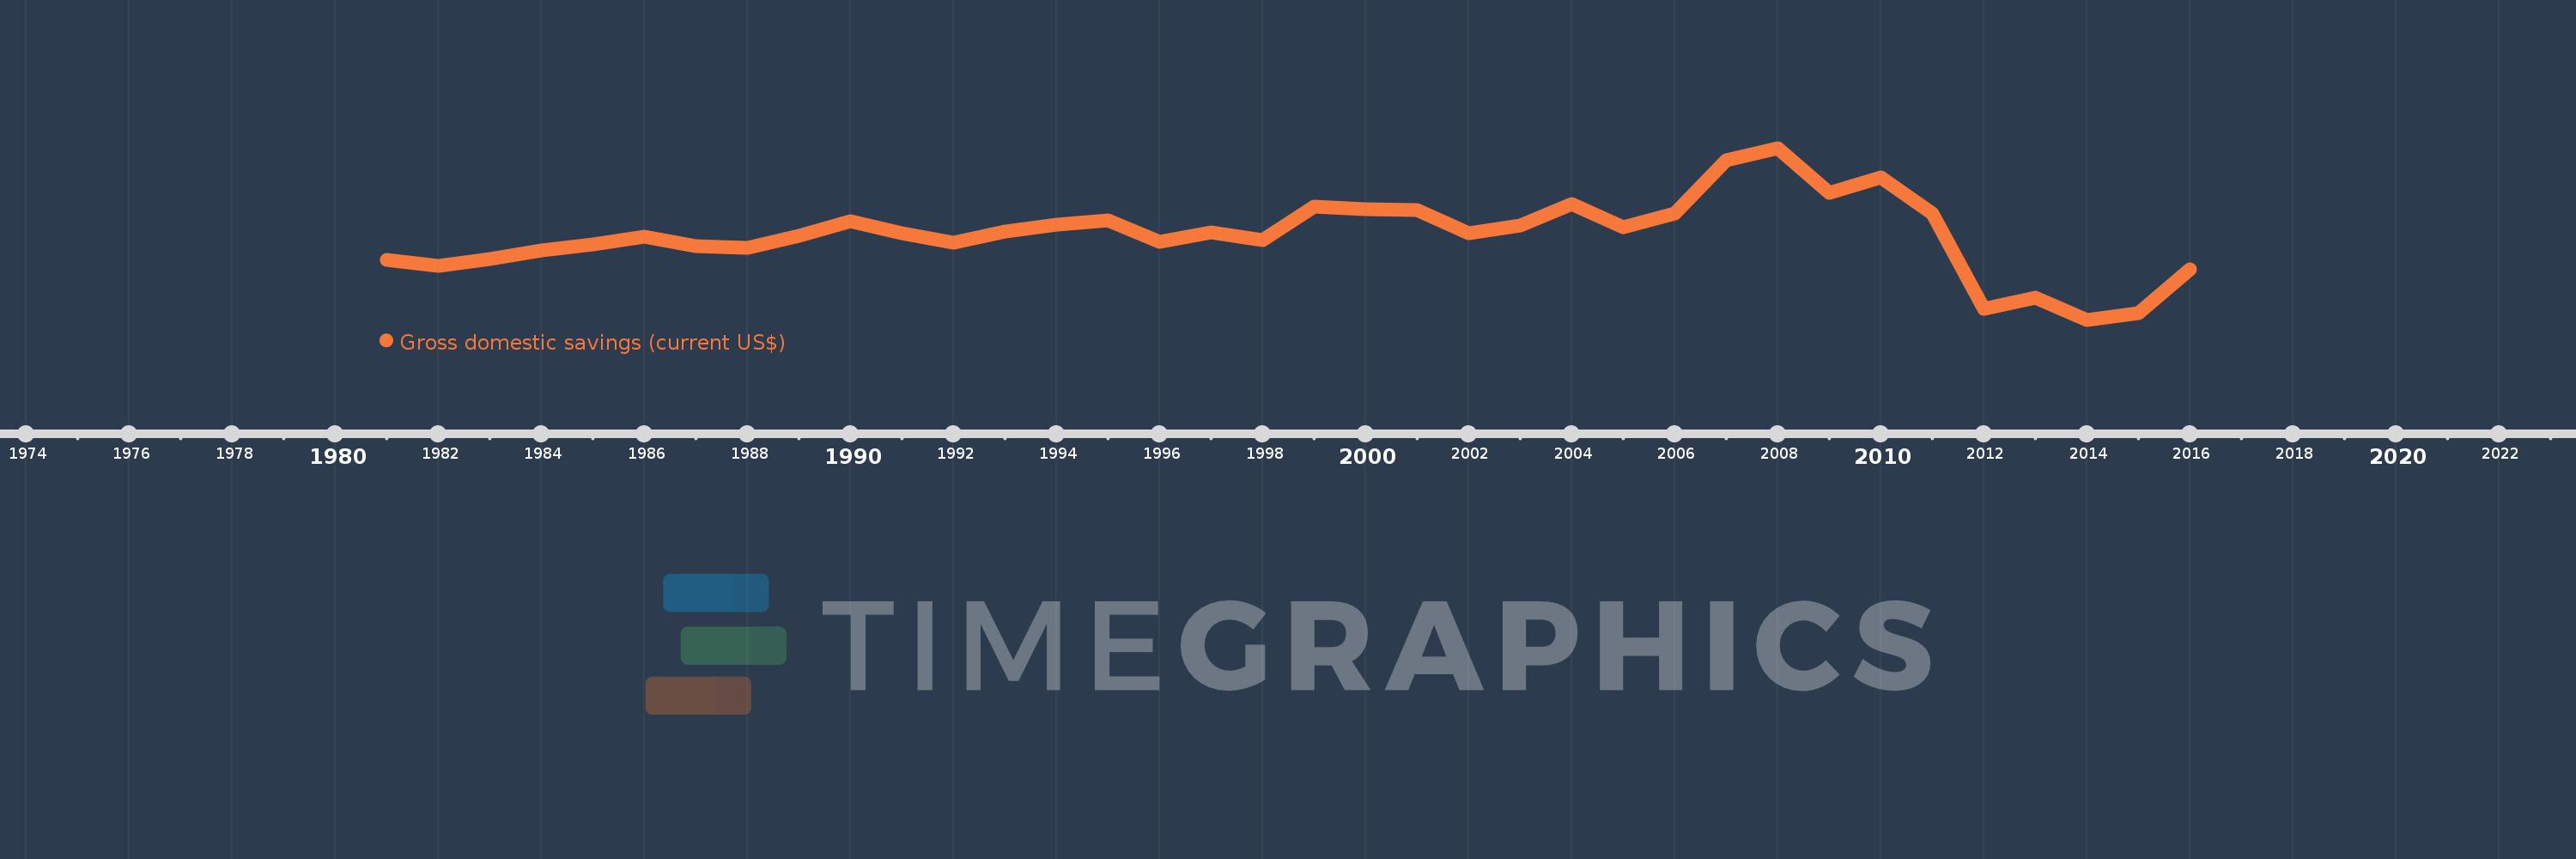
Gross domestic savings (current US$)
2016,2015,2014,2013,2012,2011,2010,2009,2008,2007,2006,2005,2004,2003,2002,2001,2000,1999,1998,1997,1996,1995,1994,1993,1992,1991,1990,1989,1988,1987,1986,1985,1984,1983,1982,1981
This statistics in other country:
AfghanistanAlbaniaAlgeriaAngolaAntigua and BarbudaArab WorldArgentinaArmeniaArubaAustraliaAustriaAzerbaijanBahamas, TheBahrainBangladeshBarbadosBelarusBelgiumBelizeBeninBermudaBhutanBoliviaBosnia and HerzegovinaBotswanaBrazilBrunei DarussalamBulgariaBurkina FasoBurundiCabo VerdeCambodiaCameroonCanadaCaribbean small statesCentral African RepublicCentral Europe and the BalticsChadChileChinaColombiaComorosCongo, Dem. Rep.Congo, Rep.Costa RicaCote d'IvoireCroatiaCubaCyprusCzech RepublicDenmarkDjiboutiDominicaDominican RepublicEarly-demographic dividendEast Asia & PacificEast Asia & Pacific (excluding high income)East Asia & Pacific (IDA & IBRD countries)EcuadorEgypt, Arab Rep.El SalvadorEquatorial GuineaEritreaEstoniaEthiopiaEuro areaEurope & Central AsiaEurope & Central Asia (excluding high income)Europe & Central Asia (IDA & IBRD countries)European UnionFaroe IslandsFijiFinlandFragile and conflict affected situationsFranceGabonGambia, TheGeorgiaGermanyGhanaGreeceGrenadaGuatemalaGuineaGuinea-BissauGuyanaHaitiHeavily indebted poor countries (HIPC)High incomeHondurasHong Kong SAR, ChinaHungaryIBRD onlyIcelandIDA & IBRD totalIDA blendIDA onlyIDA totalIndiaIndonesiaIran, Islamic Rep.IraqIrelandIsraelItalyJamaicaJapanJordanKazakhstanKenyaKiribatiKorea, Rep.KosovoKuwaitKyrgyz RepublicLao PDRLate-demographic dividendLatin America & Caribbean Latin America & Caribbean (excluding high income)Latin America & the Caribbean (IDA & IBRD countries)LatviaLeast developed countries: UN classificationLebanonLesothoLiberiaLibyaLithuaniaLow & middle incomeLow incomeLower middle incomeLuxembourgMacao SAR, ChinaMacedonia, FYRMadagascarMalawiMalaysiaMaldivesMaliMaltaMauritaniaMauritiusMexicoMicronesia, Fed. Sts.Middle East & North AfricaMiddle East & North Africa (excluding high income)Middle East & North Africa (IDA & IBRD countries)Middle incomeMoldovaMongoliaMontenegroMoroccoMozambiqueNamibiaNepalNetherlandsNew CaledoniaNew ZealandNicaraguaNigerNigeriaNorth AmericaNorwayOECD membersOmanOther small statesPakistanPanamaPapua New GuineaParaguayPeruPhilippinesPolandPortugalPost-demographic dividendPre-demographic dividendPuerto RicoQatarRomaniaRussian FederationRwandaSaudi ArabiaSenegalSerbiaSeychellesSierra LeoneSingaporeSlovak RepublicSloveniaSmall statesSolomon IslandsSouth AfricaSouth AsiaSouth Asia (IDA & IBRD)South SudanSpainSri LankaSt. Kitts and NevisSt. LuciaSt. Vincent and the GrenadinesSub-Saharan Africa Sub-Saharan Africa (excluding high income)Sub-Saharan Africa (IDA & IBRD countries)SudanSurinameSwazilandSwedenSwitzerlandSyrian Arab RepublicTajikistanTanzaniaThailandTimor-LesteTogoTongaTrinidad and TobagoTunisiaTurkeyTurkmenistanUgandaUkraineUnited Arab EmiratesUnited KingdomUnited StatesUpper middle incomeUruguayUzbekistanVanuatuVenezuela, RBVietnamWest Bank and GazaWorldYemen, Rep.ZambiaZimbabwe Timeline:
This timeline shows a graph from 1981 to 2016 of Barbados. No data until 1980. Number of actual observations by date: 36.
Source name:
World Development Indicators
Source organization:
World Bank national accounts data, and OECD National Accounts data files.
Categories, topics:
Economy & Growth
Last updated:
apr 23, 2017
Indicators value changes by year
Minimum:
18.806 mln
jan 1, 2014
Maximum:
661.45 mln
jan 1, 2008
At the date of observation
Value
Absolute change
Change from previous value
jan 1, 1981
241.319 mln
+241.319 mln
0.0%
jan 1, 1982
221.716 mln
-19.603 mln
-8.12%
jan 1, 1983
246.889 mln
+25.173 mln
11.35%
jan 1, 1984
276.927 mln
+30.038 mln
12.17%
jan 1, 1985
299.207 mln
+22.28 mln
8.05%
jan 1, 1986
330.764 mln
+31.558 mln
10.55%
jan 1, 1987
294.685 mln
-36.079 mln
-10.91%
jan 1, 1988
287.827 mln
-6.859 mln
-2.33%
jan 1, 1989
331.291 mln
+43.465 mln
15.1%
jan 1, 1990
387.44 mln
+56.149 mln
16.95%
jan 1, 1991
342.654 mln
-44.787 mln
-11.56%
jan 1, 1992
307.409 mln
-35.245 mln
-10.29%
jan 1, 1993
347.626 mln
+40.217 mln
13.08%
jan 1, 1994
374.236 mln
+26.61 mln
7.65%
jan 1, 1995
390.842 mln
+16.606 mln
4.44%
jan 1, 1996
308.656 mln
-82.186 mln
-21.03%
jan 1, 1997
346.94 mln
+38.284 mln
12.4%
jan 1, 1998
315.965 mln
-30.975 mln
-8.93%
jan 1, 1999
441.108 mln
+125.143 mln
39.61%
jan 1, 2000
433.749 mln
-7.358 mln
-1.67%
jan 1, 2001
428.35 mln
-5.399 mln
-1.24%
jan 1, 2002
342.35 mln
-86.0 mln
-20.08%
jan 1, 2003
369.75 mln
+27.4 mln
8.0%
jan 1, 2004
452.2 mln
+82.45 mln
22.3%
jan 1, 2005
363.85 mln
-88.35 mln
-19.54%
jan 1, 2006
417.55 mln
+53.7 mln
14.76%
jan 1, 2007
614.9 mln
+197.35 mln
47.26%
jan 1, 2008
661.45 mln
+46.55 mln
7.57%
jan 1, 2009
493.4 mln
-168.05 mln
-25.41%
jan 1, 2010
550.636 mln
+57.236 mln
11.6%
jan 1, 2011
417.66 mln
-132.976 mln
-24.15%
jan 1, 2012
60.043 mln
-357.617 mln
-85.62%
jan 1, 2013
99.911 mln
+39.868 mln
66.4%
jan 1, 2014
18.806 mln
-81.105 mln
-81.18%
jan 1, 2015
45.1 mln
+26.294 mln
139.82%
jan 1, 2016
207.557 mln
+162.457 mln
360.22%
Ranking of countries by current statistics by years


Comments: