29
/
en
AIzaSyAYiBZKx7MnpbEhh9jyipgxe19OcubqV5w
April 1, 2024
91197
Brazil
BRA
true
2
1
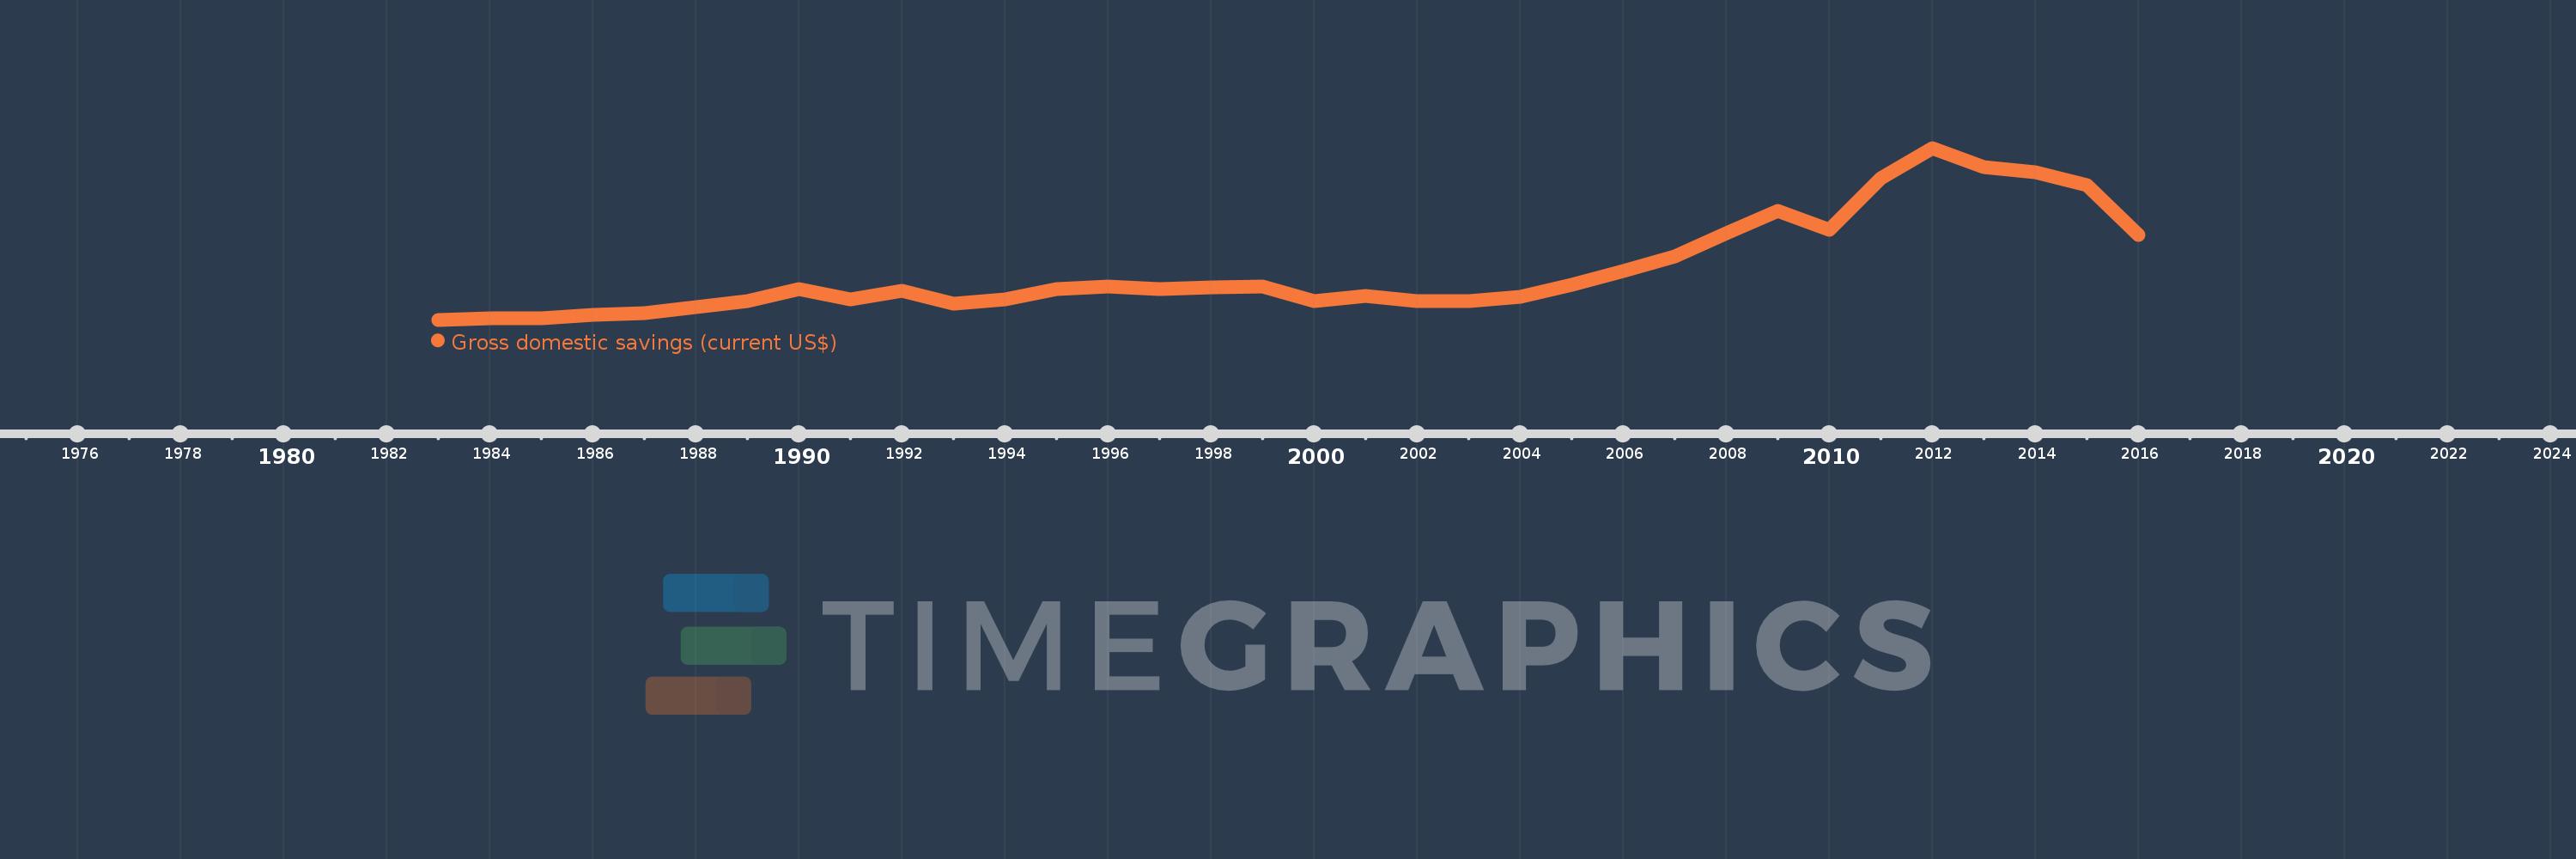
Gross domestic savings (current US$)
2016,2015,2014,2013,2012,2011,2010,2009,2008,2007,2006,2005,2004,2003,2002,2001,2000,1999,1998,1997,1996,1995,1994,1993,1992,1991,1990,1989,1988,1987,1986,1985,1984,1983
This statistics in other country:
AfghanistanAlbaniaAlgeriaAngolaAntigua and BarbudaArab WorldArgentinaArmeniaArubaAustraliaAustriaAzerbaijanBahamas, TheBahrainBangladeshBarbadosBelarusBelgiumBelizeBeninBermudaBhutanBoliviaBosnia and HerzegovinaBotswanaBrazilBrunei DarussalamBulgariaBurkina FasoBurundiCabo VerdeCambodiaCameroonCanadaCaribbean small statesCentral African RepublicCentral Europe and the BalticsChadChileChinaColombiaComorosCongo, Dem. Rep.Congo, Rep.Costa RicaCote d'IvoireCroatiaCubaCyprusCzech RepublicDenmarkDjiboutiDominicaDominican RepublicEarly-demographic dividendEast Asia & PacificEast Asia & Pacific (excluding high income)East Asia & Pacific (IDA & IBRD countries)EcuadorEgypt, Arab Rep.El SalvadorEquatorial GuineaEritreaEstoniaEthiopiaEuro areaEurope & Central AsiaEurope & Central Asia (excluding high income)Europe & Central Asia (IDA & IBRD countries)European UnionFaroe IslandsFijiFinlandFragile and conflict affected situationsFranceGabonGambia, TheGeorgiaGermanyGhanaGreeceGrenadaGuatemalaGuineaGuinea-BissauGuyanaHaitiHeavily indebted poor countries (HIPC)High incomeHondurasHong Kong SAR, ChinaHungaryIBRD onlyIcelandIDA & IBRD totalIDA blendIDA onlyIDA totalIndiaIndonesiaIran, Islamic Rep.IraqIrelandIsraelItalyJamaicaJapanJordanKazakhstanKenyaKiribatiKorea, Rep.KosovoKuwaitKyrgyz RepublicLao PDRLate-demographic dividendLatin America & Caribbean Latin America & Caribbean (excluding high income)Latin America & the Caribbean (IDA & IBRD countries)LatviaLeast developed countries: UN classificationLebanonLesothoLiberiaLibyaLithuaniaLow & middle incomeLow incomeLower middle incomeLuxembourgMacao SAR, ChinaMacedonia, FYRMadagascarMalawiMalaysiaMaldivesMaliMaltaMauritaniaMauritiusMexicoMicronesia, Fed. Sts.Middle East & North AfricaMiddle East & North Africa (excluding high income)Middle East & North Africa (IDA & IBRD countries)Middle incomeMoldovaMongoliaMontenegroMoroccoMozambiqueNamibiaNepalNetherlandsNew CaledoniaNew ZealandNicaraguaNigerNigeriaNorth AmericaNorwayOECD membersOmanOther small statesPakistanPanamaPapua New GuineaParaguayPeruPhilippinesPolandPortugalPost-demographic dividendPre-demographic dividendPuerto RicoQatarRomaniaRussian FederationRwandaSaudi ArabiaSenegalSerbiaSeychellesSierra LeoneSingaporeSlovak RepublicSloveniaSmall statesSolomon IslandsSouth AfricaSouth AsiaSouth Asia (IDA & IBRD)South SudanSpainSri LankaSt. Kitts and NevisSt. LuciaSt. Vincent and the GrenadinesSub-Saharan Africa Sub-Saharan Africa (excluding high income)Sub-Saharan Africa (IDA & IBRD countries)SudanSurinameSwazilandSwedenSwitzerlandSyrian Arab RepublicTajikistanTanzaniaThailandTimor-LesteTogoTongaTrinidad and TobagoTunisiaTurkeyTurkmenistanUgandaUkraineUnited Arab EmiratesUnited KingdomUnited StatesUpper middle incomeUruguayUzbekistanVanuatuVenezuela, RBVietnamWest Bank and GazaWorldYemen, Rep.ZambiaZimbabwe Timeline:
This timeline shows a graph from 1983 to 2016 of Brazil. No data until 1982. Number of actual observations by date: 34.
Source name:
World Development Indicators
Source organization:
World Bank national accounts data, and OECD National Accounts data files.
Categories, topics:
Economy & Growth
Last updated:
apr 23, 2017
Indicators value changes by year
Minimum:
37.545 bln
jan 1, 1983
Maximum:
550.207 bln
jan 1, 2012
At the date of observation
Value
Absolute change
Change from previous value
jan 1, 1983
37.545 bln
+37.545 bln
0.0%
jan 1, 1984
40.711 bln
+3.165 bln
8.43%
jan 1, 1985
42.849 bln
+2.138 bln
5.25%
jan 1, 1986
53.232 bln
+10.383 bln
24.23%
jan 1, 1987
57.404 bln
+4.172 bln
7.84%
jan 1, 1988
75.019 bln
+17.615 bln
30.69%
jan 1, 1989
92.201 bln
+17.182 bln
22.9%
jan 1, 1990
129.258 bln
+37.057 bln
40.19%
jan 1, 1991
98.88 bln
-30.378 bln
-23.5%
jan 1, 1992
123.78 bln
+24.9 bln
25.18%
jan 1, 1993
85.799 bln
-37.981 bln
-30.68%
jan 1, 1994
97.426 bln
+11.626 bln
13.55%
jan 1, 1995
128.314 bln
+30.888 bln
31.7%
jan 1, 1996
135.837 bln
+7.524 bln
5.86%
jan 1, 1997
128.344 bln
-7.493 bln
-5.52%
jan 1, 1998
133.851 bln
+5.506 bln
4.29%
jan 1, 1999
136.358 bln
+2.507 bln
1.87%
jan 1, 2000
93.128 bln
-43.23 bln
-31.7%
jan 1, 2001
109.059 bln
+15.932 bln
17.11%
jan 1, 2002
92.57 bln
-16.49 bln
-15.12%
jan 1, 2003
92.916 bln
+346.66 mln
0.37%
jan 1, 2004
106.516 bln
+13.6 bln
14.64%
jan 1, 2005
142.737 bln
+36.221 bln
34.01%
jan 1, 2006
183.726 bln
+40.989 bln
28.72%
jan 1, 2007
227.326 bln
+43.6 bln
23.73%
jan 1, 2008
295.931 bln
+68.605 bln
30.18%
jan 1, 2009
363.411 bln
+67.48 bln
22.8%
jan 1, 2010
306.612 bln
-56.799 bln
-15.63%
jan 1, 2011
458.569 bln
+151.956 bln
49.56%
jan 1, 2012
550.207 bln
+91.639 bln
19.98%
jan 1, 2013
493.379 bln
-56.828 bln
-10.33%
jan 1, 2014
478.931 bln
-14.448 bln
-2.93%
jan 1, 2015
438.228 bln
-40.703 bln
-8.5%
jan 1, 2016
291.586 bln
-146.643 bln
-33.46%
Ranking of countries by current statistics by years


Comments: