29
/
en
AIzaSyAYiBZKx7MnpbEhh9jyipgxe19OcubqV5w
April 1, 2024
24138
Arab World
ARB
false
2
1
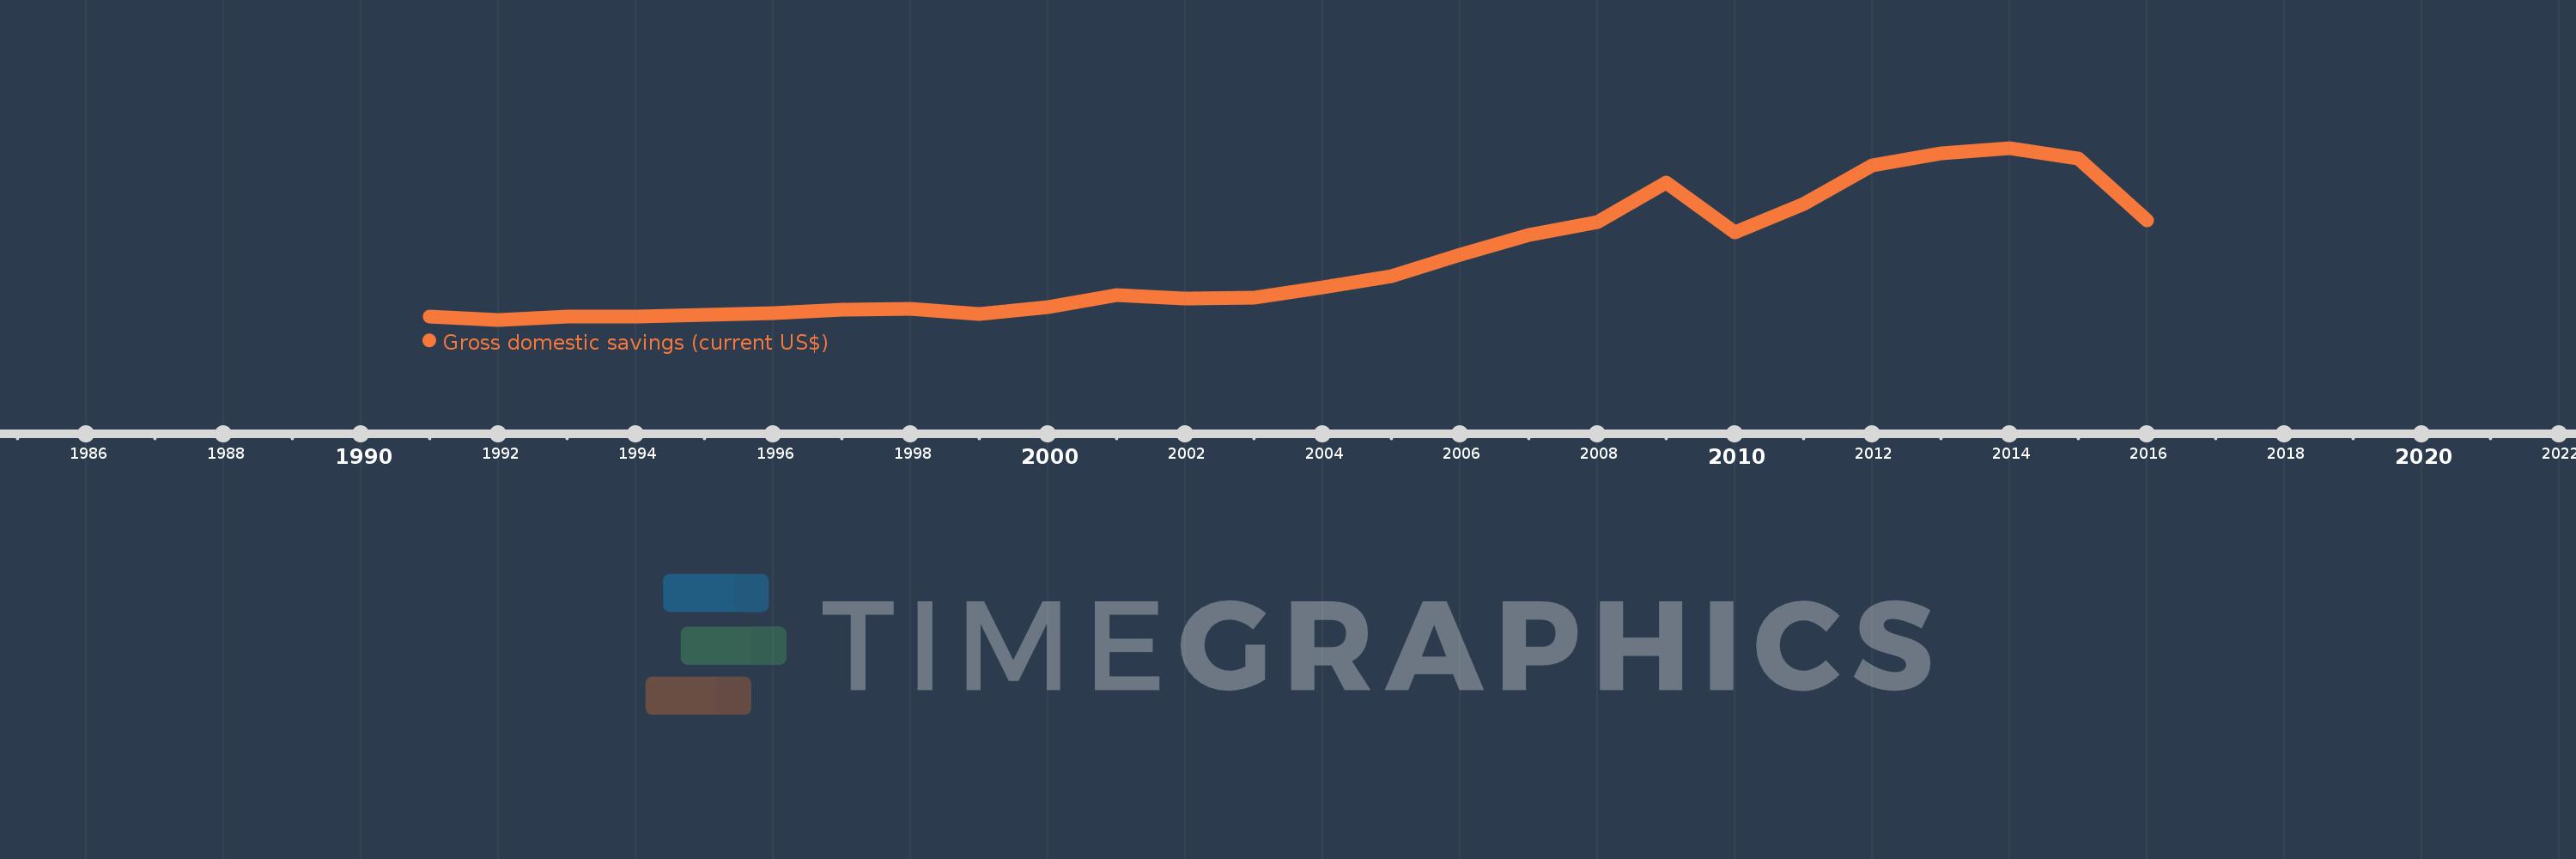
Gross domestic savings (current US$)
2016,2015,2014,2013,2012,2011,2010,2009,2008,2007,2006,2005,2004,2003,2002,2001,2000,1999,1998,1997,1996,1995,1994,1993,1992,1991
This statistics in other country:
AfghanistanAlbaniaAlgeriaAngolaAntigua and BarbudaArab WorldArgentinaArmeniaArubaAustraliaAustriaAzerbaijanBahamas, TheBahrainBangladeshBarbadosBelarusBelgiumBelizeBeninBermudaBhutanBoliviaBosnia and HerzegovinaBotswanaBrazilBrunei DarussalamBulgariaBurkina FasoBurundiCabo VerdeCambodiaCameroonCanadaCaribbean small statesCentral African RepublicCentral Europe and the BalticsChadChileChinaColombiaComorosCongo, Dem. Rep.Congo, Rep.Costa RicaCote d'IvoireCroatiaCubaCyprusCzech RepublicDenmarkDjiboutiDominicaDominican RepublicEarly-demographic dividendEast Asia & PacificEast Asia & Pacific (excluding high income)East Asia & Pacific (IDA & IBRD countries)EcuadorEgypt, Arab Rep.El SalvadorEquatorial GuineaEritreaEstoniaEthiopiaEuro areaEurope & Central AsiaEurope & Central Asia (excluding high income)Europe & Central Asia (IDA & IBRD countries)European UnionFaroe IslandsFijiFinlandFragile and conflict affected situationsFranceGabonGambia, TheGeorgiaGermanyGhanaGreeceGrenadaGuatemalaGuineaGuinea-BissauGuyanaHaitiHeavily indebted poor countries (HIPC)High incomeHondurasHong Kong SAR, ChinaHungaryIBRD onlyIcelandIDA & IBRD totalIDA blendIDA onlyIDA totalIndiaIndonesiaIran, Islamic Rep.IraqIrelandIsraelItalyJamaicaJapanJordanKazakhstanKenyaKiribatiKorea, Rep.KosovoKuwaitKyrgyz RepublicLao PDRLate-demographic dividendLatin America & Caribbean Latin America & Caribbean (excluding high income)Latin America & the Caribbean (IDA & IBRD countries)LatviaLeast developed countries: UN classificationLebanonLesothoLiberiaLibyaLithuaniaLow & middle incomeLow incomeLower middle incomeLuxembourgMacao SAR, ChinaMacedonia, FYRMadagascarMalawiMalaysiaMaldivesMaliMaltaMauritaniaMauritiusMexicoMicronesia, Fed. Sts.Middle East & North AfricaMiddle East & North Africa (excluding high income)Middle East & North Africa (IDA & IBRD countries)Middle incomeMoldovaMongoliaMontenegroMoroccoMozambiqueNamibiaNepalNetherlandsNew CaledoniaNew ZealandNicaraguaNigerNigeriaNorth AmericaNorwayOECD membersOmanOther small statesPakistanPanamaPapua New GuineaParaguayPeruPhilippinesPolandPortugalPost-demographic dividendPre-demographic dividendPuerto RicoQatarRomaniaRussian FederationRwandaSaudi ArabiaSenegalSerbiaSeychellesSierra LeoneSingaporeSlovak RepublicSloveniaSmall statesSolomon IslandsSouth AfricaSouth AsiaSouth Asia (IDA & IBRD)South SudanSpainSri LankaSt. Kitts and NevisSt. LuciaSt. Vincent and the GrenadinesSub-Saharan Africa Sub-Saharan Africa (excluding high income)Sub-Saharan Africa (IDA & IBRD countries)SudanSurinameSwazilandSwedenSwitzerlandSyrian Arab RepublicTajikistanTanzaniaThailandTimor-LesteTogoTongaTrinidad and TobagoTunisiaTurkeyTurkmenistanUgandaUkraineUnited Arab EmiratesUnited KingdomUnited StatesUpper middle incomeUruguayUzbekistanVanuatuVenezuela, RBVietnamWest Bank and GazaWorldYemen, Rep.ZambiaZimbabwe Timeline:
This timeline shows a graph from 1991 to 2016 of Arab World. No data until 1990. Number of actual observations by date: 26.
Source name:
World Development Indicators
Source organization:
World Bank national accounts data, and OECD National Accounts data files.
Categories, topics:
Economy & Growth
Last updated:
apr 23, 2017
Indicators value changes by year
Minimum:
55.08 bln
jan 1, 1992
Maximum:
1.12 trl
jan 1, 2014
At the date of observation
Value
Absolute change
Change from previous value
jan 1, 1991
74.523 bln
+74.523 bln
0.0%
jan 1, 1992
55.08 bln
-19.444 bln
-26.09%
jan 1, 1993
77.19 bln
+22.111 bln
40.14%
jan 1, 1994
74.98 bln
-2.21 bln
-2.86%
jan 1, 1995
86.767 bln
+11.787 bln
15.72%
jan 1, 1996
97.312 bln
+10.544 bln
12.15%
jan 1, 1997
118.22 bln
+20.908 bln
21.49%
jan 1, 1998
124.476 bln
+6.256 bln
5.29%
jan 1, 1999
93.321 bln
-31.155 bln
-25.03%
jan 1, 2000
131.117 bln
+37.795 bln
40.5%
jan 1, 2001
207.839 bln
+76.722 bln
58.51%
jan 1, 2002
188.807 bln
-19.032 bln
-9.16%
jan 1, 2003
194.434 bln
+5.627 bln
2.98%
jan 1, 2004
254.165 bln
+59.731 bln
30.72%
jan 1, 2005
325.63 bln
+71.464 bln
28.12%
jan 1, 2006
458.748 bln
+133.119 bln
40.88%
jan 1, 2007
581.134 bln
+122.386 bln
26.68%
jan 1, 2008
662.829 bln
+81.695 bln
14.06%
jan 1, 2009
906.498 bln
+243.669 bln
36.76%
jan 1, 2010
595.105 bln
-311.393 bln
-34.35%
jan 1, 2011
773.361 bln
+178.256 bln
29.95%
jan 1, 2012
1.013 trl
+239.686 bln
30.99%
jan 1, 2013
1.087 trl
+74.34 bln
7.34%
jan 1, 2014
1.12 trl
+33.001 bln
3.03%
jan 1, 2015
1.057 trl
-63.005 bln
-5.62%
jan 1, 2016
671.204 bln
-386.178 bln
-36.52%
Ranking of countries by current statistics by years


Comments: