29
/
en
AIzaSyAYiBZKx7MnpbEhh9jyipgxe19OcubqV5w
April 1, 2024
77164
Bahrain
BHR
true
2
1
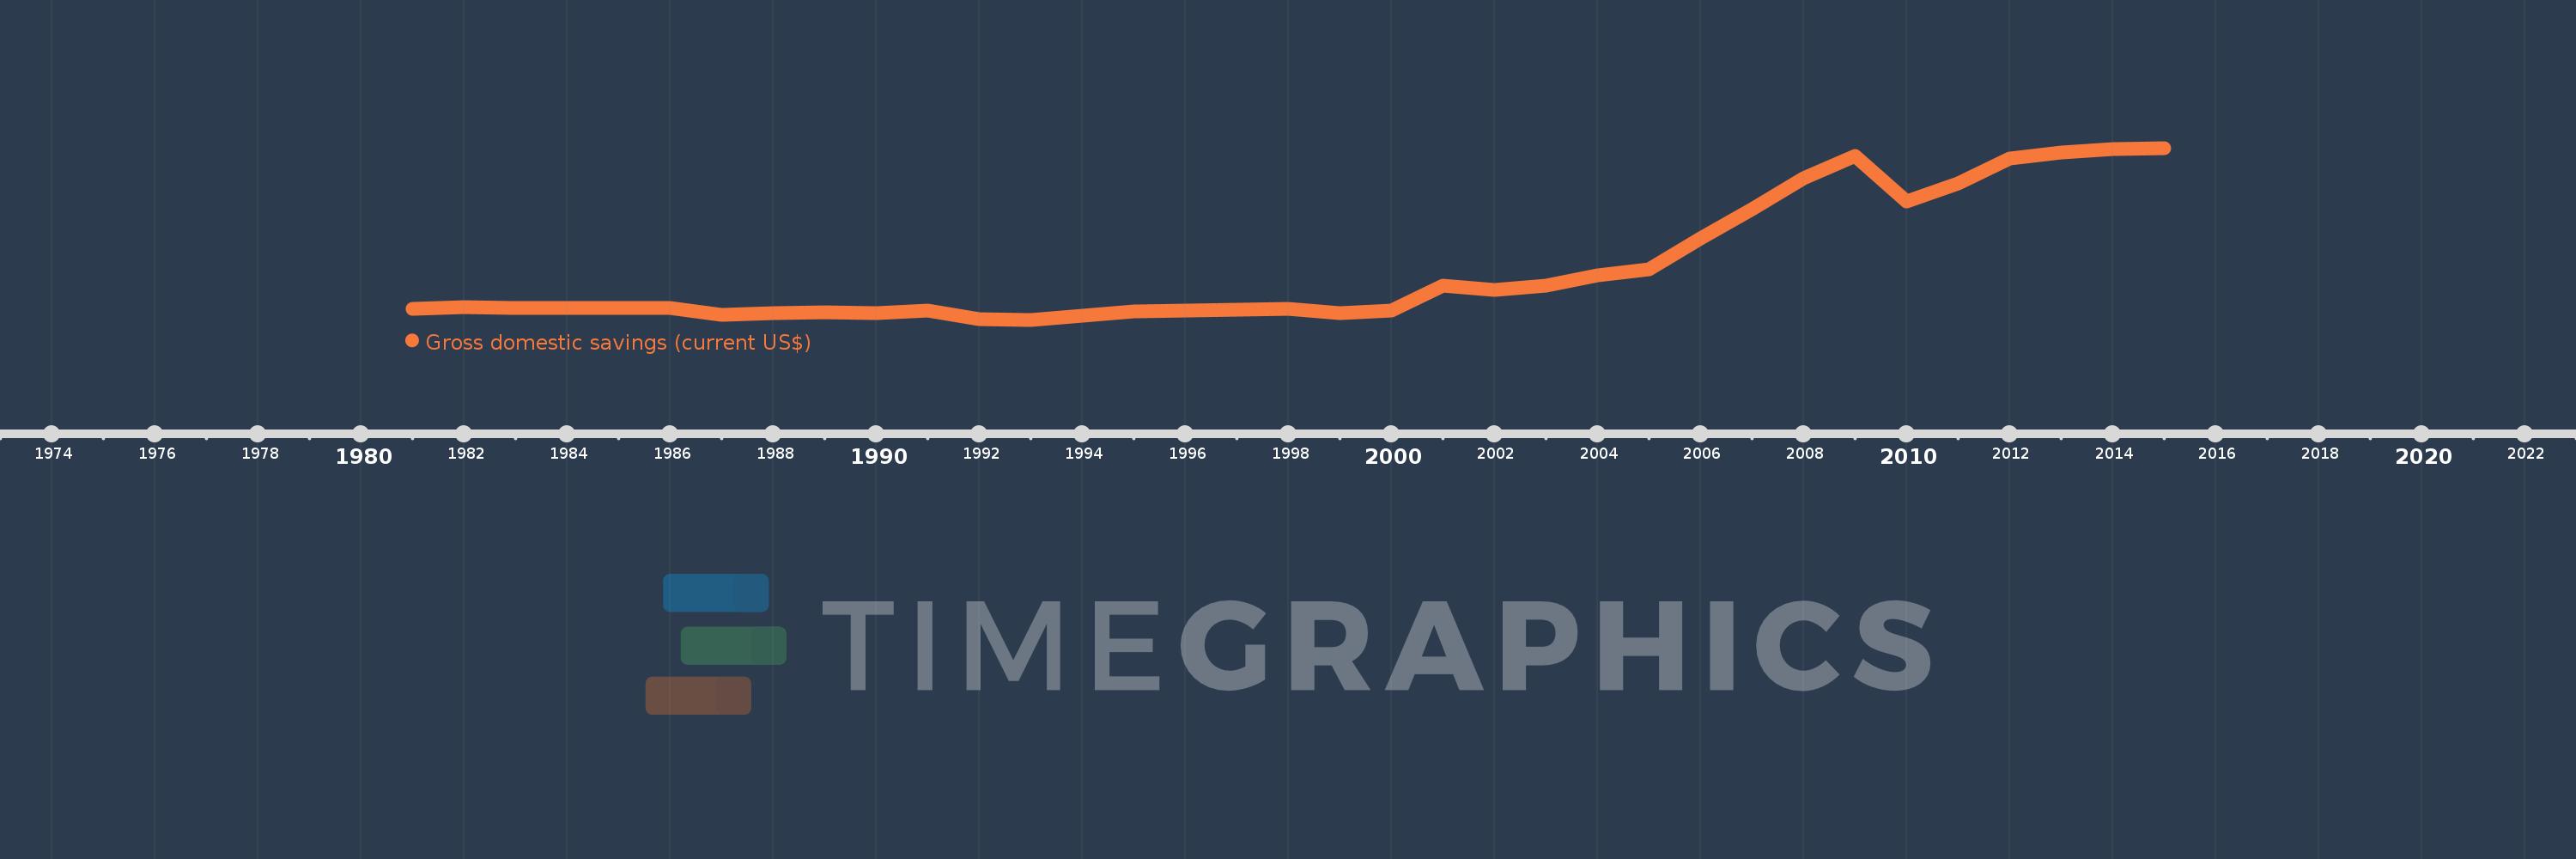
Gross domestic savings (current US$)
2015,2014,2013,2012,2011,2010,2009,2008,2007,2006,2005,2004,2003,2002,2001,2000,1999,1998,1997,1996,1995,1994,1993,1992,1991,1990,1989,1988,1987,1986,1985,1984,1983,1982,1981
This statistics in other country:
AfghanistanAlbaniaAlgeriaAngolaAntigua and BarbudaArab WorldArgentinaArmeniaArubaAustraliaAustriaAzerbaijanBahamas, TheBahrainBangladeshBarbadosBelarusBelgiumBelizeBeninBermudaBhutanBoliviaBosnia and HerzegovinaBotswanaBrazilBrunei DarussalamBulgariaBurkina FasoBurundiCabo VerdeCambodiaCameroonCanadaCaribbean small statesCentral African RepublicCentral Europe and the BalticsChadChileChinaColombiaComorosCongo, Dem. Rep.Congo, Rep.Costa RicaCote d'IvoireCroatiaCubaCyprusCzech RepublicDenmarkDjiboutiDominicaDominican RepublicEarly-demographic dividendEast Asia & PacificEast Asia & Pacific (excluding high income)East Asia & Pacific (IDA & IBRD countries)EcuadorEgypt, Arab Rep.El SalvadorEquatorial GuineaEritreaEstoniaEthiopiaEuro areaEurope & Central AsiaEurope & Central Asia (excluding high income)Europe & Central Asia (IDA & IBRD countries)European UnionFaroe IslandsFijiFinlandFragile and conflict affected situationsFranceGabonGambia, TheGeorgiaGermanyGhanaGreeceGrenadaGuatemalaGuineaGuinea-BissauGuyanaHaitiHeavily indebted poor countries (HIPC)High incomeHondurasHong Kong SAR, ChinaHungaryIBRD onlyIcelandIDA & IBRD totalIDA blendIDA onlyIDA totalIndiaIndonesiaIran, Islamic Rep.IraqIrelandIsraelItalyJamaicaJapanJordanKazakhstanKenyaKiribatiKorea, Rep.KosovoKuwaitKyrgyz RepublicLao PDRLate-demographic dividendLatin America & Caribbean Latin America & Caribbean (excluding high income)Latin America & the Caribbean (IDA & IBRD countries)LatviaLeast developed countries: UN classificationLebanonLesothoLiberiaLibyaLithuaniaLow & middle incomeLow incomeLower middle incomeLuxembourgMacao SAR, ChinaMacedonia, FYRMadagascarMalawiMalaysiaMaldivesMaliMaltaMauritaniaMauritiusMexicoMicronesia, Fed. Sts.Middle East & North AfricaMiddle East & North Africa (excluding high income)Middle East & North Africa (IDA & IBRD countries)Middle incomeMoldovaMongoliaMontenegroMoroccoMozambiqueNamibiaNepalNetherlandsNew CaledoniaNew ZealandNicaraguaNigerNigeriaNorth AmericaNorwayOECD membersOmanOther small statesPakistanPanamaPapua New GuineaParaguayPeruPhilippinesPolandPortugalPost-demographic dividendPre-demographic dividendPuerto RicoQatarRomaniaRussian FederationRwandaSaudi ArabiaSenegalSerbiaSeychellesSierra LeoneSingaporeSlovak RepublicSloveniaSmall statesSolomon IslandsSouth AfricaSouth AsiaSouth Asia (IDA & IBRD)South SudanSpainSri LankaSt. Kitts and NevisSt. LuciaSt. Vincent and the GrenadinesSub-Saharan Africa Sub-Saharan Africa (excluding high income)Sub-Saharan Africa (IDA & IBRD countries)SudanSurinameSwazilandSwedenSwitzerlandSyrian Arab RepublicTajikistanTanzaniaThailandTimor-LesteTogoTongaTrinidad and TobagoTunisiaTurkeyTurkmenistanUgandaUkraineUnited Arab EmiratesUnited KingdomUnited StatesUpper middle incomeUruguayUzbekistanVanuatuVenezuela, RBVietnamWest Bank and GazaWorldYemen, Rep.ZambiaZimbabwe Timeline:
This timeline shows a graph from 1981 to 2015 of Bahrain. No data until 1980. Number of actual observations by date: 35.
Source name:
World Development Indicators
Source organization:
World Bank national accounts data, and OECD National Accounts data files.
Categories, topics:
Economy & Growth
Last updated:
apr 23, 2017
Indicators value changes by year
Minimum:
810.372 mln
jan 1, 1993
Maximum:
14.672 bln
jan 1, 2015
At the date of observation
Value
Absolute change
Change from previous value
jan 1, 1981
1.69 bln
+1.69 bln
0.0%
jan 1, 1982
1.829 bln
+138.885 mln
8.22%
jan 1, 1983
1.768 bln
-61.17 mln
-3.34%
jan 1, 1984
1.777 bln
+9.839 mln
0.56%
jan 1, 1985
1.766 bln
-11.169 mln
-0.63%
jan 1, 1986
1.738 bln
-28.723 mln
-1.63%
jan 1, 1987
1.237 bln
-500.532 mln
-28.81%
jan 1, 1988
1.371 bln
+134.309 mln
10.86%
jan 1, 1989
1.409 bln
+37.234 mln
2.72%
jan 1, 1990
1.377 bln
-31.117 mln
-2.21%
jan 1, 1991
1.581 bln
+203.723 mln
14.79%
jan 1, 1992
829.255 mln
-751.861 mln
-47.55%
jan 1, 1993
810.372 mln
-18.883 mln
-2.28%
jan 1, 1994
1.115 bln
+305.053 mln
37.64%
jan 1, 1995
1.494 bln
+378.989 mln
33.98%
jan 1, 1996
1.528 bln
+33.777 mln
2.26%
jan 1, 1997
1.594 bln
+65.425 mln
4.28%
jan 1, 1998
1.715 bln
+121.809 mln
7.64%
jan 1, 1999
1.369 bln
-346.277 mln
-20.19%
jan 1, 2000
1.576 bln
+207.181 mln
15.13%
jan 1, 2001
3.546 bln
+1.97 bln
124.96%
jan 1, 2002
3.223 bln
-323.178 mln
-9.11%
jan 1, 2003
3.572 bln
+348.903 mln
10.83%
jan 1, 2004
4.405 bln
+832.715 mln
23.31%
jan 1, 2005
4.865 bln
+460.137 mln
10.45%
jan 1, 2006
7.379 bln
+2.514 bln
51.69%
jan 1, 2007
9.726 bln
+2.347 bln
31.81%
jan 1, 2008
12.231 bln
+2.505 bln
25.75%
jan 1, 2009
13.998 bln
+1.767 bln
14.44%
jan 1, 2010
10.348 bln
-3.65 bln
-26.08%
jan 1, 2011
11.799 bln
+1.452 bln
14.03%
jan 1, 2012
13.806 bln
+2.007 bln
17.01%
jan 1, 2013
14.322 bln
+515.505 mln
3.73%
jan 1, 2014
14.578 bln
+255.745 mln
1.79%
jan 1, 2015
14.672 bln
+94.388 mln
0.65%
Ranking of countries by current statistics by years


Comments: