29
/
en
AIzaSyAYiBZKx7MnpbEhh9jyipgxe19OcubqV5w
April 1, 2024
81798
Belgium
BEL
true
2
1
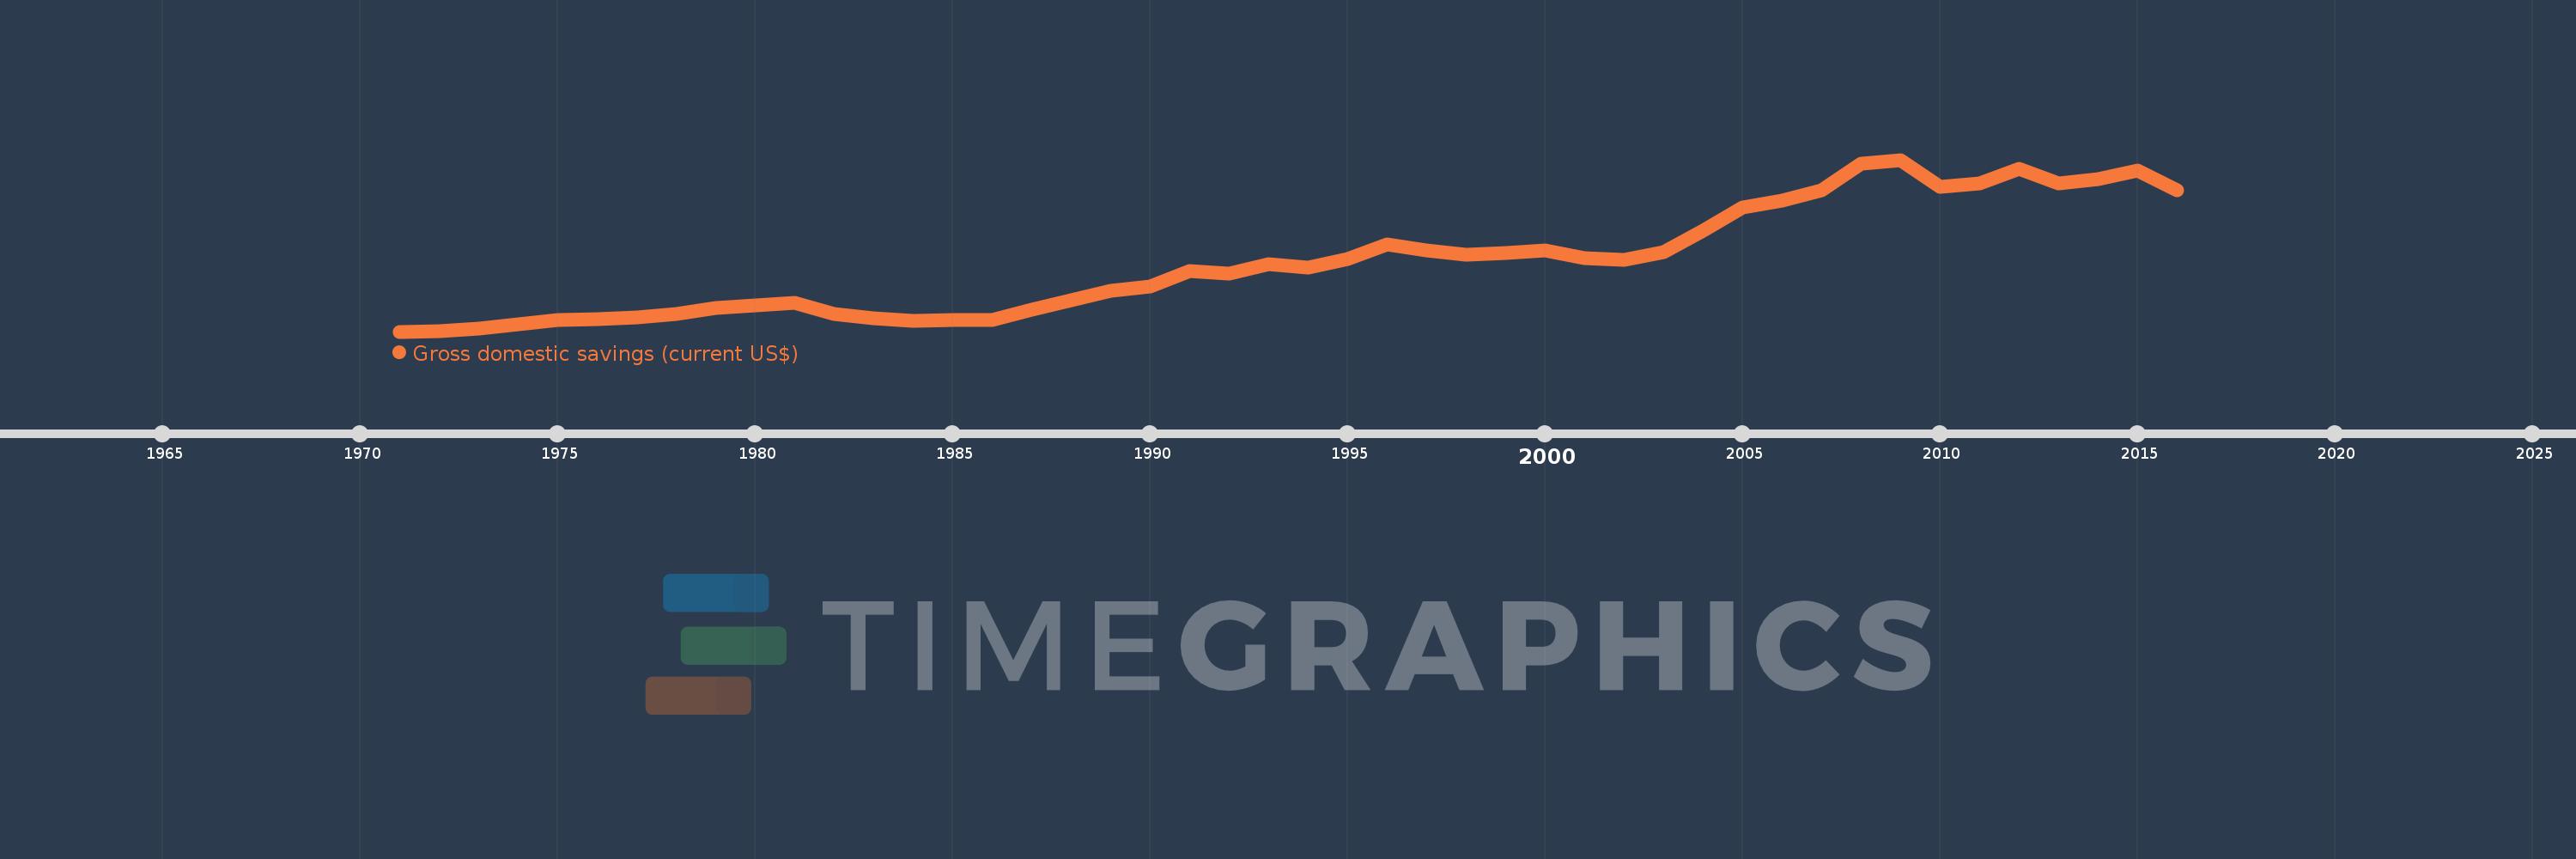
Gross domestic savings (current US$)
2016,2015,2014,2013,2012,2011,2010,2009,2008,2007,2006,2005,2004,2003,2002,2001,2000,1999,1998,1997,1996,1995,1994,1993,1992,1991,1990,1989,1988,1987,1986,1985,1984,1983,1982,1981,1980,1979,1978,1977,1976,1975,1974,1973,1972,1971
This statistics in other country:
AfghanistanAlbaniaAlgeriaAngolaAntigua and BarbudaArab WorldArgentinaArmeniaArubaAustraliaAustriaAzerbaijanBahamas, TheBahrainBangladeshBarbadosBelarusBelgiumBelizeBeninBermudaBhutanBoliviaBosnia and HerzegovinaBotswanaBrazilBrunei DarussalamBulgariaBurkina FasoBurundiCabo VerdeCambodiaCameroonCanadaCaribbean small statesCentral African RepublicCentral Europe and the BalticsChadChileChinaColombiaComorosCongo, Dem. Rep.Congo, Rep.Costa RicaCote d'IvoireCroatiaCubaCyprusCzech RepublicDenmarkDjiboutiDominicaDominican RepublicEarly-demographic dividendEast Asia & PacificEast Asia & Pacific (excluding high income)East Asia & Pacific (IDA & IBRD countries)EcuadorEgypt, Arab Rep.El SalvadorEquatorial GuineaEritreaEstoniaEthiopiaEuro areaEurope & Central AsiaEurope & Central Asia (excluding high income)Europe & Central Asia (IDA & IBRD countries)European UnionFaroe IslandsFijiFinlandFragile and conflict affected situationsFranceGabonGambia, TheGeorgiaGermanyGhanaGreeceGrenadaGuatemalaGuineaGuinea-BissauGuyanaHaitiHeavily indebted poor countries (HIPC)High incomeHondurasHong Kong SAR, ChinaHungaryIBRD onlyIcelandIDA & IBRD totalIDA blendIDA onlyIDA totalIndiaIndonesiaIran, Islamic Rep.IraqIrelandIsraelItalyJamaicaJapanJordanKazakhstanKenyaKiribatiKorea, Rep.KosovoKuwaitKyrgyz RepublicLao PDRLate-demographic dividendLatin America & Caribbean Latin America & Caribbean (excluding high income)Latin America & the Caribbean (IDA & IBRD countries)LatviaLeast developed countries: UN classificationLebanonLesothoLiberiaLibyaLithuaniaLow & middle incomeLow incomeLower middle incomeLuxembourgMacao SAR, ChinaMacedonia, FYRMadagascarMalawiMalaysiaMaldivesMaliMaltaMauritaniaMauritiusMexicoMicronesia, Fed. Sts.Middle East & North AfricaMiddle East & North Africa (excluding high income)Middle East & North Africa (IDA & IBRD countries)Middle incomeMoldovaMongoliaMontenegroMoroccoMozambiqueNamibiaNepalNetherlandsNew CaledoniaNew ZealandNicaraguaNigerNigeriaNorth AmericaNorwayOECD membersOmanOther small statesPakistanPanamaPapua New GuineaParaguayPeruPhilippinesPolandPortugalPost-demographic dividendPre-demographic dividendPuerto RicoQatarRomaniaRussian FederationRwandaSaudi ArabiaSenegalSerbiaSeychellesSierra LeoneSingaporeSlovak RepublicSloveniaSmall statesSolomon IslandsSouth AfricaSouth AsiaSouth Asia (IDA & IBRD)South SudanSpainSri LankaSt. Kitts and NevisSt. LuciaSt. Vincent and the GrenadinesSub-Saharan Africa Sub-Saharan Africa (excluding high income)Sub-Saharan Africa (IDA & IBRD countries)SudanSurinameSwazilandSwedenSwitzerlandSyrian Arab RepublicTajikistanTanzaniaThailandTimor-LesteTogoTongaTrinidad and TobagoTunisiaTurkeyTurkmenistanUgandaUkraineUnited Arab EmiratesUnited KingdomUnited StatesUpper middle incomeUruguayUzbekistanVanuatuVenezuela, RBVietnamWest Bank and GazaWorldYemen, Rep.ZambiaZimbabwe Timeline:
This timeline shows a graph from 1971 to 2016 of Belgium. No data until 1970. Number of actual observations by date: 46.
Source name:
World Development Indicators
Source organization:
World Bank national accounts data, and OECD National Accounts data files.
Categories, topics:
Economy & Growth
Last updated:
apr 23, 2017
Indicators value changes by year
Minimum:
8.485 bln
jan 1, 1971
Maximum:
135.955 bln
jan 1, 2009
At the date of observation
Value
Absolute change
Change from previous value
jan 1, 1971
8.485 bln
+8.485 bln
0.0%
jan 1, 1972
9.077 bln
+591.855 mln
6.98%
jan 1, 1973
10.989 bln
+1.913 bln
21.07%
jan 1, 1974
14.041 bln
+3.052 bln
27.77%
jan 1, 1975
17.197 bln
+3.156 bln
22.48%
jan 1, 1976
17.629 bln
+431.313 mln
2.51%
jan 1, 1977
19.311 bln
+1.682 bln
9.54%
jan 1, 1978
21.423 bln
+2.112 bln
10.94%
jan 1, 1979
25.849 bln
+4.426 bln
20.66%
jan 1, 1980
28.03 bln
+2.181 bln
8.44%
jan 1, 1981
29.938 bln
+1.908 bln
6.81%
jan 1, 1982
21.258 bln
-8.68 bln
-28.99%
jan 1, 1983
18.114 bln
-3.145 bln
-14.79%
jan 1, 1984
16.488 bln
-1.626 bln
-8.98%
jan 1, 1985
16.796 bln
+308.464 mln
1.87%
jan 1, 1986
17.042 bln
+246.073 mln
1.47%
jan 1, 1987
24.701 bln
+7.659 bln
44.94%
jan 1, 1988
31.736 bln
+7.035 bln
28.48%
jan 1, 1989
39.018 bln
+7.281 bln
22.94%
jan 1, 1990
41.867 bln
+2.85 bln
7.3%
jan 1, 1991
53.171 bln
+11.304 bln
27.0%
jan 1, 1992
51.569 bln
-1.602 bln
-3.01%
jan 1, 1993
58.546 bln
+6.977 bln
13.53%
jan 1, 1994
56.052 bln
-2.494 bln
-4.26%
jan 1, 1995
62.262 bln
+6.21 bln
11.08%
jan 1, 1996
73.228 bln
+10.965 bln
17.61%
jan 1, 1997
68.922 bln
-4.306 bln
-5.88%
jan 1, 1998
65.544 bln
-3.378 bln
-4.9%
jan 1, 1999
67.044 bln
+1.5 bln
2.29%
jan 1, 2000
68.987 bln
+1.943 bln
2.9%
jan 1, 2001
62.85 bln
-6.138 bln
-8.9%
jan 1, 2002
61.692 bln
-1.157 bln
-1.84%
jan 1, 2003
67.742 bln
+6.05 bln
9.81%
jan 1, 2004
83.14 bln
+15.398 bln
22.73%
jan 1, 2005
100.869 bln
+17.729 bln
21.32%
jan 1, 2006
105.656 bln
+4.787 bln
4.75%
jan 1, 2007
113.16 bln
+7.504 bln
7.1%
jan 1, 2008
133.363 bln
+20.203 bln
17.85%
jan 1, 2009
135.955 bln
+2.592 bln
1.94%
jan 1, 2010
115.94 bln
-20.015 bln
-14.72%
jan 1, 2011
118.422 bln
+2.482 bln
2.14%
jan 1, 2012
129.149 bln
+10.727 bln
9.06%
jan 1, 2013
118.602 bln
-10.547 bln
-8.17%
jan 1, 2014
121.39 bln
+2.788 bln
2.35%
jan 1, 2015
127.863 bln
+6.473 bln
5.33%
jan 1, 2016
113.229 bln
-14.634 bln
-11.44%
Ranking of countries by current statistics by years


Comments: