29
/
en
AIzaSyAYiBZKx7MnpbEhh9jyipgxe19OcubqV5w
April 1, 2024
251932
St. Vincent and the Grenadines
VCT
true
2
1
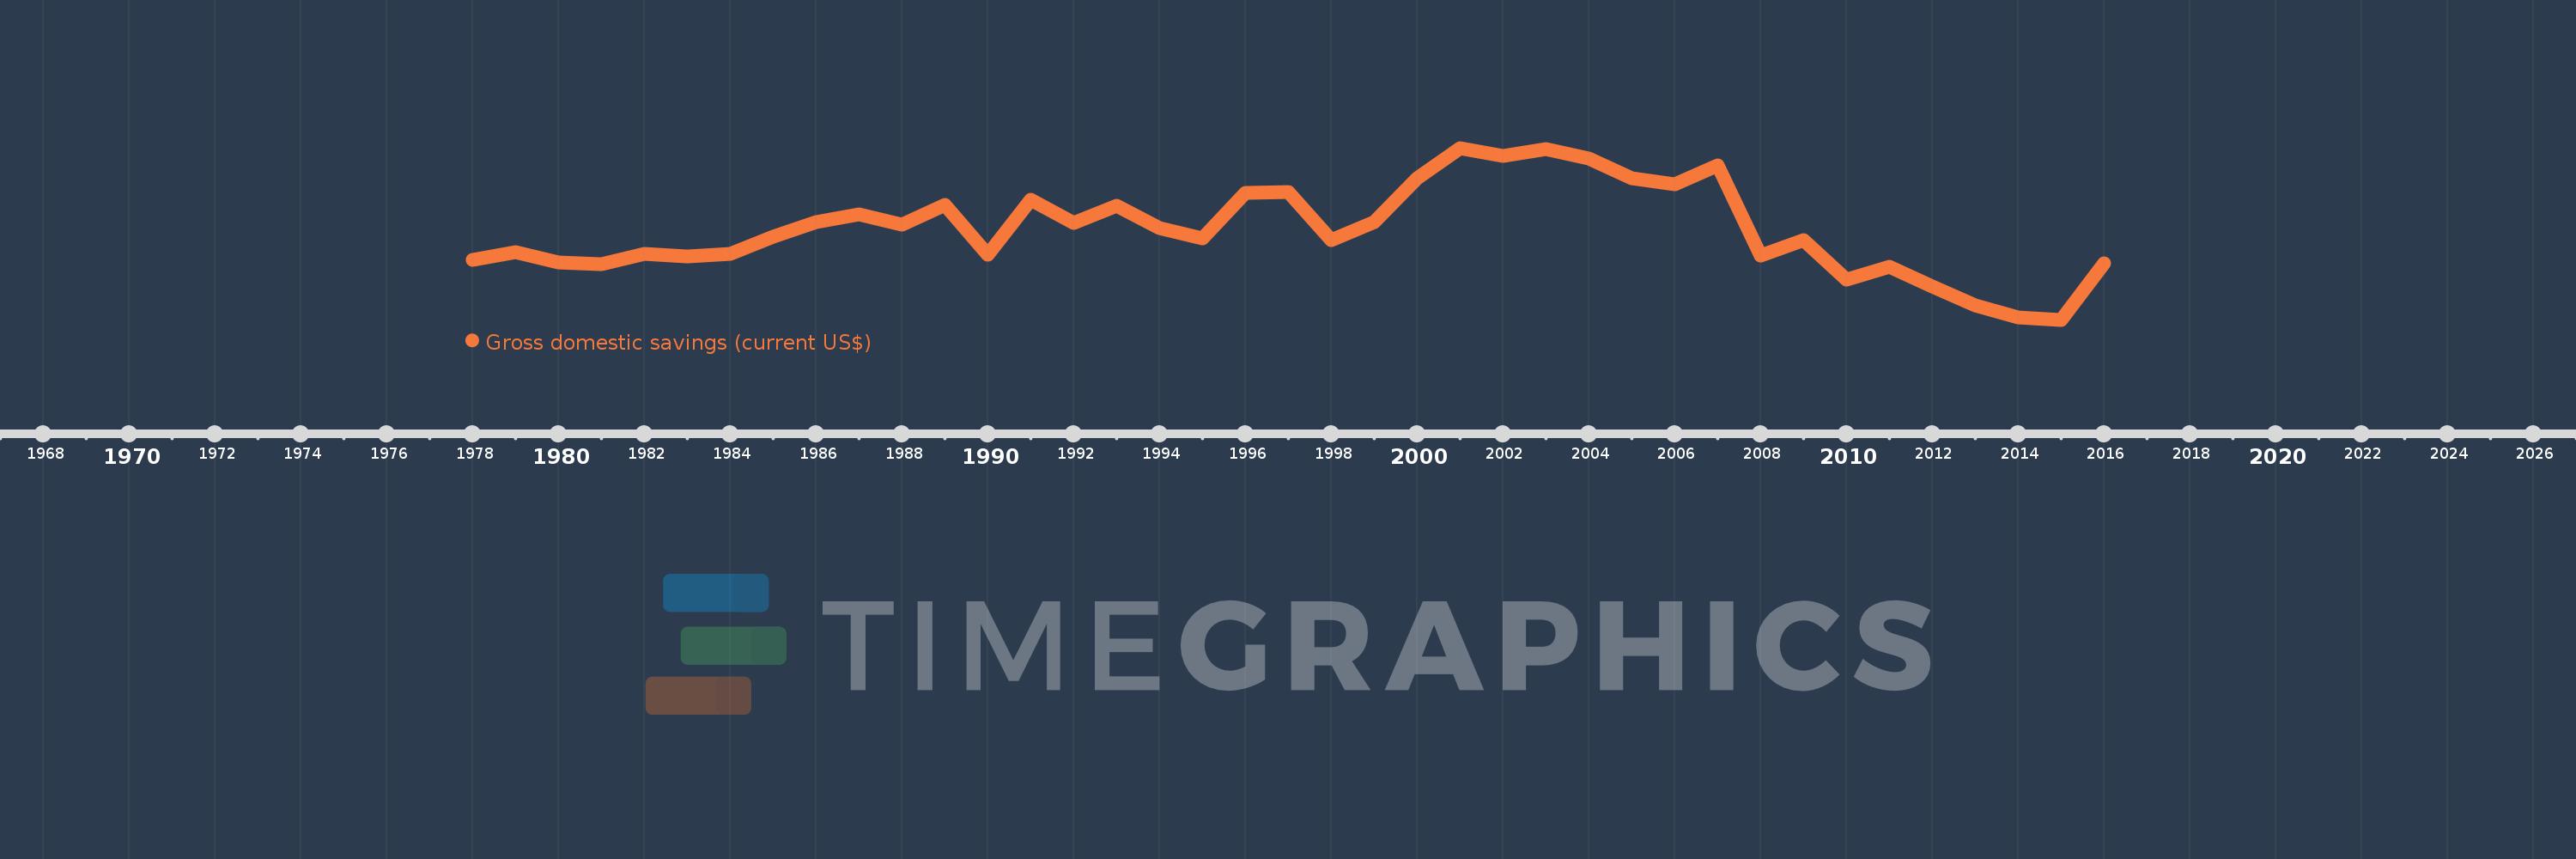
Gross domestic savings (current US$)
2016,2015,2014,2013,2012,2011,2010,2009,2008,2007,2006,2005,2004,2003,2002,2001,2000,1999,1998,1997,1996,1995,1994,1993,1992,1991,1990,1989,1988,1987,1986,1985,1984,1983,1982,1981,1980,1979,1978
This statistics in other country:
AfghanistanAlbaniaAlgeriaAngolaAntigua and BarbudaArab WorldArgentinaArmeniaArubaAustraliaAustriaAzerbaijanBahamas, TheBahrainBangladeshBarbadosBelarusBelgiumBelizeBeninBermudaBhutanBoliviaBosnia and HerzegovinaBotswanaBrazilBrunei DarussalamBulgariaBurkina FasoBurundiCabo VerdeCambodiaCameroonCanadaCaribbean small statesCentral African RepublicCentral Europe and the BalticsChadChileChinaColombiaComorosCongo, Dem. Rep.Congo, Rep.Costa RicaCote d'IvoireCroatiaCubaCyprusCzech RepublicDenmarkDjiboutiDominicaDominican RepublicEarly-demographic dividendEast Asia & PacificEast Asia & Pacific (excluding high income)East Asia & Pacific (IDA & IBRD countries)EcuadorEgypt, Arab Rep.El SalvadorEquatorial GuineaEritreaEstoniaEthiopiaEuro areaEurope & Central AsiaEurope & Central Asia (excluding high income)Europe & Central Asia (IDA & IBRD countries)European UnionFaroe IslandsFijiFinlandFragile and conflict affected situationsFranceGabonGambia, TheGeorgiaGermanyGhanaGreeceGrenadaGuatemalaGuineaGuinea-BissauGuyanaHaitiHeavily indebted poor countries (HIPC)High incomeHondurasHong Kong SAR, ChinaHungaryIBRD onlyIcelandIDA & IBRD totalIDA blendIDA onlyIDA totalIndiaIndonesiaIran, Islamic Rep.IraqIrelandIsraelItalyJamaicaJapanJordanKazakhstanKenyaKiribatiKorea, Rep.KosovoKuwaitKyrgyz RepublicLao PDRLate-demographic dividendLatin America & Caribbean Latin America & Caribbean (excluding high income)Latin America & the Caribbean (IDA & IBRD countries)LatviaLeast developed countries: UN classificationLebanonLesothoLiberiaLibyaLithuaniaLow & middle incomeLow incomeLower middle incomeLuxembourgMacao SAR, ChinaMacedonia, FYRMadagascarMalawiMalaysiaMaldivesMaliMaltaMauritaniaMauritiusMexicoMicronesia, Fed. Sts.Middle East & North AfricaMiddle East & North Africa (excluding high income)Middle East & North Africa (IDA & IBRD countries)Middle incomeMoldovaMongoliaMontenegroMoroccoMozambiqueNamibiaNepalNetherlandsNew CaledoniaNew ZealandNicaraguaNigerNigeriaNorth AmericaNorwayOECD membersOmanOther small statesPakistanPanamaPapua New GuineaParaguayPeruPhilippinesPolandPortugalPost-demographic dividendPre-demographic dividendPuerto RicoQatarRomaniaRussian FederationRwandaSaudi ArabiaSenegalSerbiaSeychellesSierra LeoneSingaporeSlovak RepublicSloveniaSmall statesSolomon IslandsSouth AfricaSouth AsiaSouth Asia (IDA & IBRD)South SudanSpainSri LankaSt. Kitts and NevisSt. LuciaSt. Vincent and the GrenadinesSub-Saharan Africa Sub-Saharan Africa (excluding high income)Sub-Saharan Africa (IDA & IBRD countries)SudanSurinameSwazilandSwedenSwitzerlandSyrian Arab RepublicTajikistanTanzaniaThailandTimor-LesteTogoTongaTrinidad and TobagoTunisiaTurkeyTurkmenistanUgandaUkraineUnited Arab EmiratesUnited KingdomUnited StatesUpper middle incomeUruguayUzbekistanVanuatuVenezuela, RBVietnamWest Bank and GazaWorldYemen, Rep.ZambiaZimbabwe Timeline:
This timeline shows a graph from 1978 to 2016 of St. Vincent and the Grenadines. No data until 1977. Number of actual observations by date: 39.
Source name:
World Development Indicators
Source organization:
World Bank national accounts data, and OECD National Accounts data files.
Categories, topics:
Economy & Growth
Last updated:
apr 23, 2017
Indicators value changes by year
Minimum:
-44.057 mln
jan 1, 2015
Maximum:
71.707 mln
jan 1, 2001
At the date of observation
Value
Absolute change
Change from previous value
jan 1, 1978
-3.481 mln
-3.481 mln
0.0%
jan 1, 1979
1.641 mln
+5.122 mln
-147.13%
jan 1, 1980
-5.656 mln
-7.296 mln
-444.7%
jan 1, 1981
-6.893 mln
-1.237 mln
21.87%
jan 1, 1982
500.0K
+7.393 mln
-107.25%
jan 1, 1983
-1.507 mln
-2.007 mln
-401.48%
jan 1, 1984
433.333K
+1.941 mln
-128.75%
jan 1, 1985
11.793 mln
+11.359 mln
2.62K%
jan 1, 1986
21.767 mln
+9.974 mln
84.58%
jan 1, 1987
27.144 mln
+5.378 mln
24.71%
jan 1, 1988
19.881 mln
-7.263 mln
-26.76%
jan 1, 1989
33.07 mln
+13.189 mln
66.34%
jan 1, 1990
-244.444K
-33.315 mln
-100.74%
jan 1, 1991
36.815 mln
+37.059 mln
-15.16K%
jan 1, 1992
21.056 mln
-15.759 mln
-42.81%
jan 1, 1993
32.859 mln
+11.804 mln
56.06%
jan 1, 1994
17.785 mln
-15.074 mln
-45.87%
jan 1, 1995
10.852 mln
-6.933 mln
-38.98%
jan 1, 1996
41.593 mln
+30.741 mln
283.28%
jan 1, 1997
41.763 mln
+170.37K
0.41%
jan 1, 1998
9.704 mln
-32.059 mln
-76.76%
jan 1, 1999
21.807 mln
+12.104 mln
124.73%
jan 1, 2000
51.43 mln
+29.622 mln
135.84%
jan 1, 2001
71.707 mln
+20.278 mln
39.43%
jan 1, 2002
66.062 mln
-5.645 mln
-7.87%
jan 1, 2003
70.861 mln
+4.798 mln
7.26%
jan 1, 2004
64.434 mln
-6.426 mln
-9.07%
jan 1, 2005
51.059 mln
-13.375 mln
-20.76%
jan 1, 2006
47.444 mln
-3.616 mln
-7.08%
jan 1, 2007
60.052 mln
+12.609 mln
26.58%
jan 1, 2008
-1.039 mln
-61.091 mln
-101.73%
jan 1, 2009
9.872 mln
+10.911 mln
-1.05K%
jan 1, 2010
-16.874 mln
-26.746 mln
-270.92%
jan 1, 2011
-8.518 mln
+8.356 mln
-49.52%
jan 1, 2012
-21.856 mln
-13.338 mln
156.58%
jan 1, 2013
-34.531 mln
-12.675 mln
57.99%
jan 1, 2014
-42.457 mln
-7.926 mln
22.95%
jan 1, 2015
-44.057 mln
-1.6 mln
3.77%
jan 1, 2016
-5.896 mln
+38.161 mln
-86.62%
Ranking of countries by current statistics by years


Comments: