29
/
en
AIzaSyAYiBZKx7MnpbEhh9jyipgxe19OcubqV5w
April 1, 2024
272293
Uganda
UGA
true
2
1
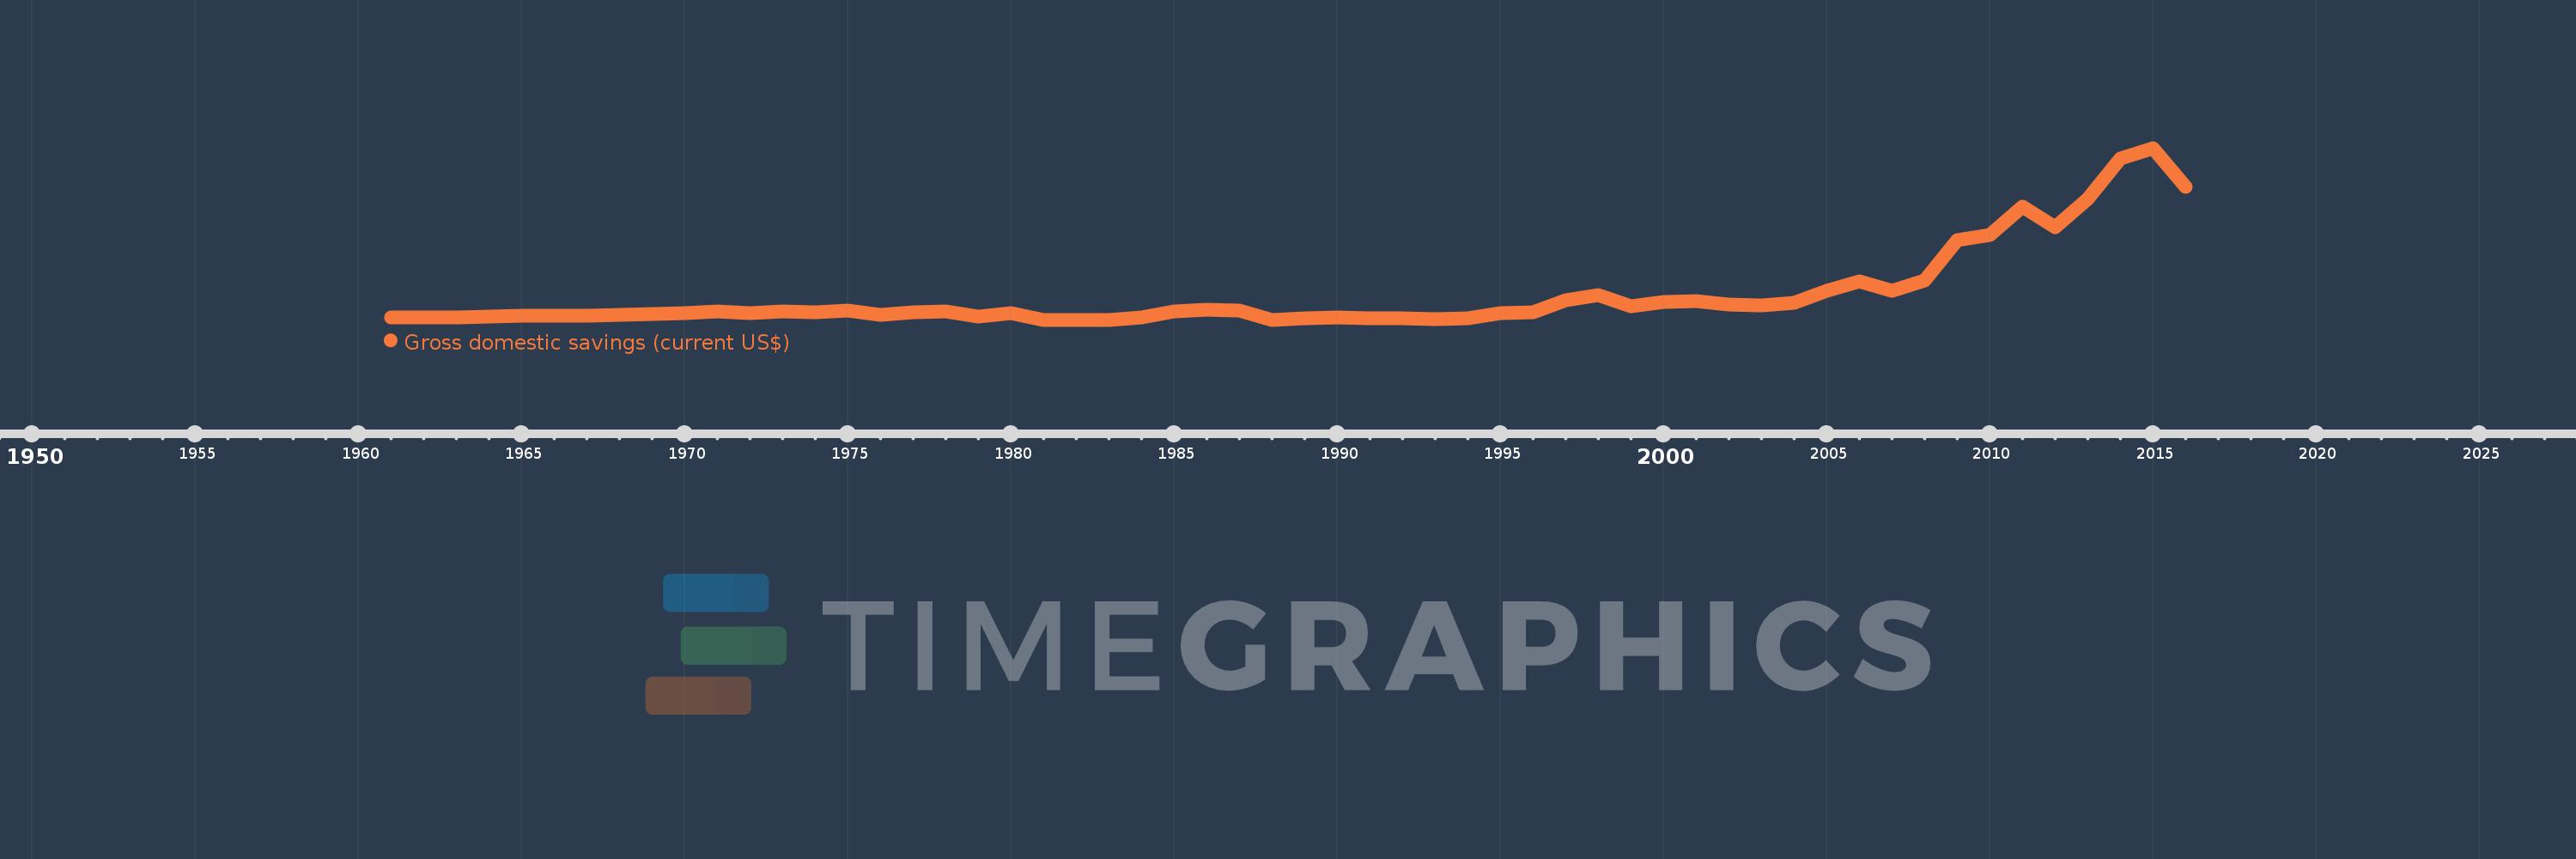
Gross domestic savings (current US$)
2016,2015,2014,2013,2012,2011,2010,2009,2008,2007,2006,2005,2004,2003,2002,2001,2000,1999,1998,1997,1996,1995,1994,1993,1992,1991,1990,1989,1988,1987,1986,1985,1984,1983,1982,1981,1980,1979,1978,1977,1976,1975,1974,1973,1972,1971,1970,1969,1968,1967,1966,1965,1964,1963,1962,1961
This statistics in other country:
AfghanistanAlbaniaAlgeriaAngolaAntigua and BarbudaArab WorldArgentinaArmeniaArubaAustraliaAustriaAzerbaijanBahamas, TheBahrainBangladeshBarbadosBelarusBelgiumBelizeBeninBermudaBhutanBoliviaBosnia and HerzegovinaBotswanaBrazilBrunei DarussalamBulgariaBurkina FasoBurundiCabo VerdeCambodiaCameroonCanadaCaribbean small statesCentral African RepublicCentral Europe and the BalticsChadChileChinaColombiaComorosCongo, Dem. Rep.Congo, Rep.Costa RicaCote d'IvoireCroatiaCubaCyprusCzech RepublicDenmarkDjiboutiDominicaDominican RepublicEarly-demographic dividendEast Asia & PacificEast Asia & Pacific (excluding high income)East Asia & Pacific (IDA & IBRD countries)EcuadorEgypt, Arab Rep.El SalvadorEquatorial GuineaEritreaEstoniaEthiopiaEuro areaEurope & Central AsiaEurope & Central Asia (excluding high income)Europe & Central Asia (IDA & IBRD countries)European UnionFaroe IslandsFijiFinlandFragile and conflict affected situationsFranceGabonGambia, TheGeorgiaGermanyGhanaGreeceGrenadaGuatemalaGuineaGuinea-BissauGuyanaHaitiHeavily indebted poor countries (HIPC)High incomeHondurasHong Kong SAR, ChinaHungaryIBRD onlyIcelandIDA & IBRD totalIDA blendIDA onlyIDA totalIndiaIndonesiaIran, Islamic Rep.IraqIrelandIsraelItalyJamaicaJapanJordanKazakhstanKenyaKiribatiKorea, Rep.KosovoKuwaitKyrgyz RepublicLao PDRLate-demographic dividendLatin America & Caribbean Latin America & Caribbean (excluding high income)Latin America & the Caribbean (IDA & IBRD countries)LatviaLeast developed countries: UN classificationLebanonLesothoLiberiaLibyaLithuaniaLow & middle incomeLow incomeLower middle incomeLuxembourgMacao SAR, ChinaMacedonia, FYRMadagascarMalawiMalaysiaMaldivesMaliMaltaMauritaniaMauritiusMexicoMicronesia, Fed. Sts.Middle East & North AfricaMiddle East & North Africa (excluding high income)Middle East & North Africa (IDA & IBRD countries)Middle incomeMoldovaMongoliaMontenegroMoroccoMozambiqueNamibiaNepalNetherlandsNew CaledoniaNew ZealandNicaraguaNigerNigeriaNorth AmericaNorwayOECD membersOmanOther small statesPakistanPanamaPapua New GuineaParaguayPeruPhilippinesPolandPortugalPost-demographic dividendPre-demographic dividendPuerto RicoQatarRomaniaRussian FederationRwandaSaudi ArabiaSenegalSerbiaSeychellesSierra LeoneSingaporeSlovak RepublicSloveniaSmall statesSolomon IslandsSouth AfricaSouth AsiaSouth Asia (IDA & IBRD)South SudanSpainSri LankaSt. Kitts and NevisSt. LuciaSt. Vincent and the GrenadinesSub-Saharan Africa Sub-Saharan Africa (excluding high income)Sub-Saharan Africa (IDA & IBRD countries)SudanSurinameSwazilandSwedenSwitzerlandSyrian Arab RepublicTajikistanTanzaniaThailandTimor-LesteTogoTongaTrinidad and TobagoTunisiaTurkeyTurkmenistanUgandaUkraineUnited Arab EmiratesUnited KingdomUnited StatesUpper middle incomeUruguayUzbekistanVanuatuVenezuela, RBVietnamWest Bank and GazaWorldYemen, Rep.ZambiaZimbabwe Timeline:
This timeline shows a graph from 1961 to 2016 of Uganda. No data until 1960. Number of actual observations by date: 56.
Source name:
World Development Indicators
Source organization:
World Bank national accounts data, and OECD National Accounts data files.
Categories, topics:
Economy & Growth
Last updated:
apr 23, 2017
Indicators value changes by year
Minimum:
-5.4 mln
jan 1, 1981
Maximum:
4.724 bln
jan 1, 2015
At the date of observation
Value
Absolute change
Change from previous value
jan 1, 1961
69.7 mln
+69.7 mln
0.0%
jan 1, 1962
57.198 mln
-12.502 mln
-17.94%
jan 1, 1963
61.999 mln
+4.801 mln
8.39%
jan 1, 1964
88.86 mln
+26.861 mln
43.32%
jan 1, 1965
111.269 mln
+22.41 mln
25.22%
jan 1, 1966
110.224 mln
-1.045 mln
-0.94%
jan 1, 1967
108.683 mln
-1.541 mln
-1.4%
jan 1, 1968
139.076 mln
+30.392 mln
27.96%
jan 1, 1969
149.58 mln
+10.504 mln
7.55%
jan 1, 1970
177.731 mln
+28.151 mln
18.82%
jan 1, 1971
217.227 mln
+39.496 mln
22.22%
jan 1, 1972
169.608 mln
-47.619 mln
-21.92%
jan 1, 1973
212.605 mln
+42.997 mln
25.35%
jan 1, 1974
206.303 mln
-6.303 mln
-2.96%
jan 1, 1975
237.09 mln
+30.787 mln
14.92%
jan 1, 1976
136.556 mln
-100.534 mln
-42.4%
jan 1, 1977
196.6 mln
+60.044 mln
43.97%
jan 1, 1978
217.412 mln
+20.812 mln
10.59%
jan 1, 1979
74.348 mln
-143.064 mln
-65.8%
jan 1, 1980
180.75 mln
+106.402 mln
143.11%
jan 1, 1981
-5.4 mln
-186.15 mln
-102.99%
jan 1, 1982
-5.0 mln
+400.0K
-7.41%
jan 1, 1983
-1000.0K
+4.0 mln
-80.0%
jan 1, 1984
54.333 mln
+55.333 mln
-5.53K%
jan 1, 1985
235.274 mln
+180.941 mln
333.02%
jan 1, 1986
262.645 mln
+27.371 mln
11.63%
jan 1, 1987
236.13 mln
-26.515 mln
-10.1%
jan 1, 1988
-4.889 mln
-241.019 mln
-102.07%
jan 1, 1989
38.25 mln
+43.139 mln
-882.4%
jan 1, 1990
52.628 mln
+14.378 mln
37.59%
jan 1, 1991
24.792 mln
-27.835 mln
-52.89%
jan 1, 1992
23.183 mln
-1.609 mln
-6.49%
jan 1, 1993
11.686 mln
-11.497 mln
-49.59%
jan 1, 1994
36.423 mln
+24.737 mln
211.68%
jan 1, 1995
172.527 mln
+136.104 mln
373.68%
jan 1, 1996
194.136 mln
+21.608 mln
12.52%
jan 1, 1997
526.449 mln
+332.313 mln
171.18%
jan 1, 1998
673.265 mln
+146.816 mln
27.89%
jan 1, 1999
374.104 mln
-299.16 mln
-44.43%
jan 1, 2000
481.538 mln
+107.434 mln
28.72%
jan 1, 2001
497.789 mln
+16.251 mln
3.37%
jan 1, 2002
409.317 mln
-88.472 mln
-17.77%
jan 1, 2003
393.339 mln
-15.978 mln
-3.9%
jan 1, 2004
454.459 mln
+61.12 mln
15.54%
jan 1, 2005
800.338 mln
+345.879 mln
76.11%
jan 1, 2006
1.056 bln
+256.107 mln
32.0%
jan 1, 2007
800.171 mln
-256.273 mln
-24.26%
jan 1, 2008
1.076 bln
+276.16 mln
34.51%
jan 1, 2009
2.176 bln
+1.099 bln
102.14%
jan 1, 2010
2.324 bln
+147.858 mln
6.8%
jan 1, 2011
3.099 bln
+775.081 mln
33.36%
jan 1, 2012
2.534 bln
-564.825 mln
-18.23%
jan 1, 2013
3.33 bln
+795.83 mln
31.41%
jan 1, 2014
4.441 bln
+1.111 bln
33.37%
jan 1, 2015
4.724 bln
+283.153 mln
6.38%
jan 1, 2016
3.655 bln
-1.069 bln
-22.64%
Ranking of countries by current statistics by years


Comments: