29
/
en
AIzaSyAYiBZKx7MnpbEhh9jyipgxe19OcubqV5w
April 1, 2024
136777
Gambia, The
GMB
true
2
1
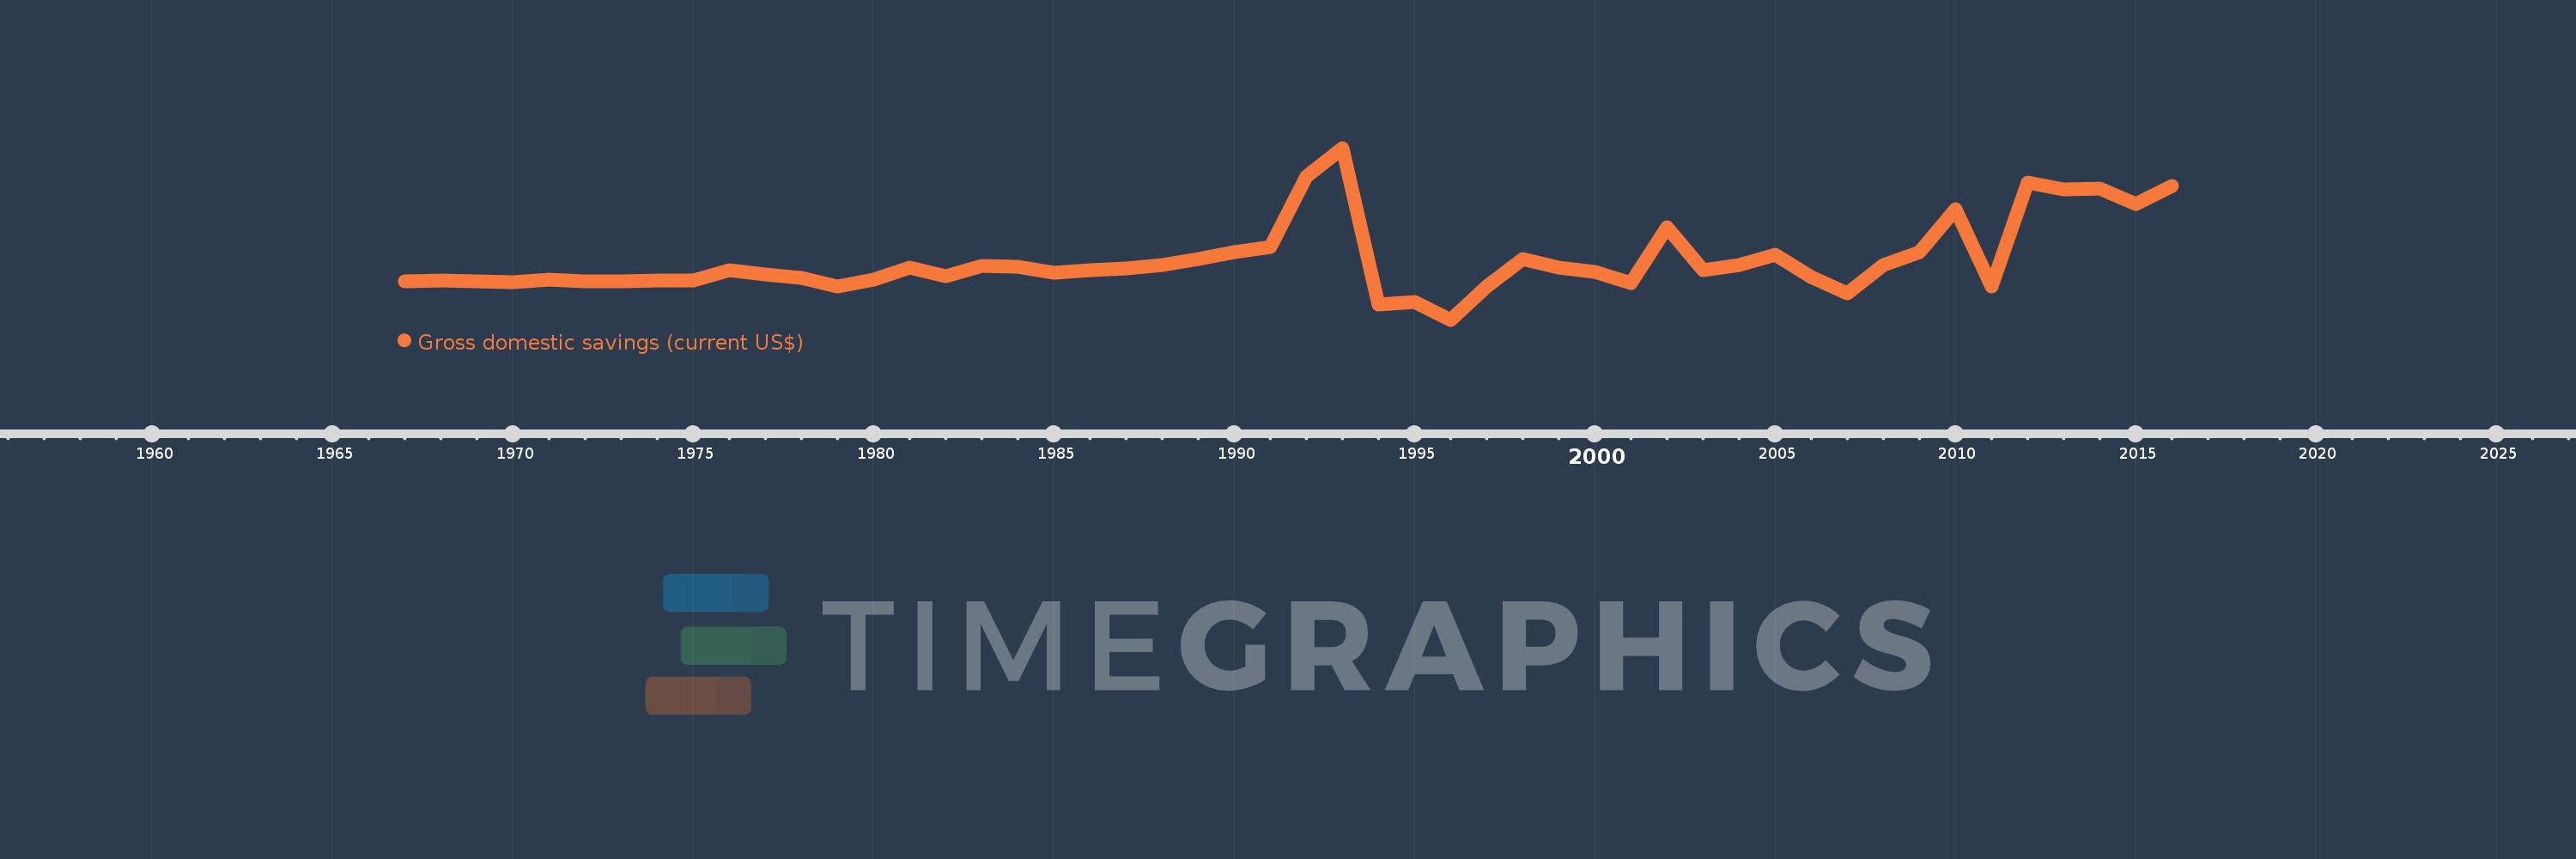
Gross domestic savings (current US$)
2016,2015,2014,2013,2012,2011,2010,2009,2008,2007,2006,2005,2004,2003,2002,2001,2000,1999,1998,1997,1996,1995,1994,1993,1992,1991,1990,1989,1988,1987,1986,1985,1984,1983,1982,1981,1980,1979,1978,1977,1976,1975,1974,1973,1972,1971,1970,1969,1968,1967
This statistics in other country:
AfghanistanAlbaniaAlgeriaAngolaAntigua and BarbudaArab WorldArgentinaArmeniaArubaAustraliaAustriaAzerbaijanBahamas, TheBahrainBangladeshBarbadosBelarusBelgiumBelizeBeninBermudaBhutanBoliviaBosnia and HerzegovinaBotswanaBrazilBrunei DarussalamBulgariaBurkina FasoBurundiCabo VerdeCambodiaCameroonCanadaCaribbean small statesCentral African RepublicCentral Europe and the BalticsChadChileChinaColombiaComorosCongo, Dem. Rep.Congo, Rep.Costa RicaCote d'IvoireCroatiaCubaCyprusCzech RepublicDenmarkDjiboutiDominicaDominican RepublicEarly-demographic dividendEast Asia & PacificEast Asia & Pacific (excluding high income)East Asia & Pacific (IDA & IBRD countries)EcuadorEgypt, Arab Rep.El SalvadorEquatorial GuineaEritreaEstoniaEthiopiaEuro areaEurope & Central AsiaEurope & Central Asia (excluding high income)Europe & Central Asia (IDA & IBRD countries)European UnionFaroe IslandsFijiFinlandFragile and conflict affected situationsFranceGabonGambia, TheGeorgiaGermanyGhanaGreeceGrenadaGuatemalaGuineaGuinea-BissauGuyanaHaitiHeavily indebted poor countries (HIPC)High incomeHondurasHong Kong SAR, ChinaHungaryIBRD onlyIcelandIDA & IBRD totalIDA blendIDA onlyIDA totalIndiaIndonesiaIran, Islamic Rep.IraqIrelandIsraelItalyJamaicaJapanJordanKazakhstanKenyaKiribatiKorea, Rep.KosovoKuwaitKyrgyz RepublicLao PDRLate-demographic dividendLatin America & Caribbean Latin America & Caribbean (excluding high income)Latin America & the Caribbean (IDA & IBRD countries)LatviaLeast developed countries: UN classificationLebanonLesothoLiberiaLibyaLithuaniaLow & middle incomeLow incomeLower middle incomeLuxembourgMacao SAR, ChinaMacedonia, FYRMadagascarMalawiMalaysiaMaldivesMaliMaltaMauritaniaMauritiusMexicoMicronesia, Fed. Sts.Middle East & North AfricaMiddle East & North Africa (excluding high income)Middle East & North Africa (IDA & IBRD countries)Middle incomeMoldovaMongoliaMontenegroMoroccoMozambiqueNamibiaNepalNetherlandsNew CaledoniaNew ZealandNicaraguaNigerNigeriaNorth AmericaNorwayOECD membersOmanOther small statesPakistanPanamaPapua New GuineaParaguayPeruPhilippinesPolandPortugalPost-demographic dividendPre-demographic dividendPuerto RicoQatarRomaniaRussian FederationRwandaSaudi ArabiaSenegalSerbiaSeychellesSierra LeoneSingaporeSlovak RepublicSloveniaSmall statesSolomon IslandsSouth AfricaSouth AsiaSouth Asia (IDA & IBRD)South SudanSpainSri LankaSt. Kitts and NevisSt. LuciaSt. Vincent and the GrenadinesSub-Saharan Africa Sub-Saharan Africa (excluding high income)Sub-Saharan Africa (IDA & IBRD countries)SudanSurinameSwazilandSwedenSwitzerlandSyrian Arab RepublicTajikistanTanzaniaThailandTimor-LesteTogoTongaTrinidad and TobagoTunisiaTurkeyTurkmenistanUgandaUkraineUnited Arab EmiratesUnited KingdomUnited StatesUpper middle incomeUruguayUzbekistanVanuatuVenezuela, RBVietnamWest Bank and GazaWorldYemen, Rep.ZambiaZimbabwe Timeline:
This timeline shows a graph from 1967 to 2016 of Gambia, The. No data until 1966. Number of actual observations by date: 50.
Source name:
World Development Indicators
Source organization:
World Bank national accounts data, and OECD National Accounts data files.
Categories, topics:
Economy & Growth
Last updated:
apr 23, 2017
Indicators value changes by year
Minimum:
-37.899 mln
jan 1, 1996
Maximum:
132.363 mln
jan 1, 1993
At the date of observation
Value
Absolute change
Change from previous value
jan 1, 1967
341.043K
+341.043K
0.0%
jan 1, 1968
1.176 mln
+835.386K
244.95%
jan 1, 1969
-169.827K
-1.346 mln
-114.44%
jan 1, 1970
-297.077K
-127.25K
74.93%
jan 1, 1971
1.973 mln
+2.27 mln
-764.11%
jan 1, 1972
434.148K
-1.539 mln
-77.99%
jan 1, 1973
144.306K
-289.842K
-66.76%
jan 1, 1974
632.754K
+488.448K
338.48%
jan 1, 1975
1.164 mln
+530.844K
83.89%
jan 1, 1976
11.102 mln
+9.939 mln
854.15%
jan 1, 1977
7.24 mln
-3.862 mln
-34.79%
jan 1, 1978
3.448 mln
-3.792 mln
-52.37%
jan 1, 1979
-5.282 mln
-8.73 mln
-253.18%
jan 1, 1980
1.645 mln
+6.926 mln
-131.13%
jan 1, 1981
14.063 mln
+12.418 mln
755.13%
jan 1, 1982
5.552 mln
-8.511 mln
-60.52%
jan 1, 1983
15.462 mln
+9.91 mln
178.48%
jan 1, 1984
14.705 mln
-757.08K
-4.9%
jan 1, 1985
8.245 mln
-6.46 mln
-43.93%
jan 1, 1986
11.364 mln
+3.119 mln
37.83%
jan 1, 1987
13.227 mln
+1.864 mln
16.4%
jan 1, 1988
16.011 mln
+2.783 mln
21.04%
jan 1, 1989
22.05 mln
+6.039 mln
37.72%
jan 1, 1990
28.832 mln
+6.782 mln
30.76%
jan 1, 1991
33.811 mln
+4.979 mln
17.27%
jan 1, 1992
104.325 mln
+70.513 mln
208.55%
jan 1, 1993
132.363 mln
+28.039 mln
26.88%
jan 1, 1994
-22.411 mln
-154.774 mln
-116.93%
jan 1, 1995
-20.539 mln
+1.872 mln
-8.35%
jan 1, 1996
-37.899 mln
-17.361 mln
84.53%
jan 1, 1997
-4.902 mln
+32.998 mln
-87.07%
jan 1, 1998
21.875 mln
+26.777 mln
-546.3%
jan 1, 1999
13.651 mln
-8.224 mln
-37.6%
jan 1, 2000
9.259 mln
-4.392 mln
-32.17%
jan 1, 2001
-1.566 mln
-10.825 mln
-116.91%
jan 1, 2002
54.203 mln
+55.768 mln
-3.56K%
jan 1, 2003
11.276 mln
-42.926 mln
-79.2%
jan 1, 2004
16.402 mln
+5.125 mln
45.45%
jan 1, 2005
26.805 mln
+10.403 mln
63.43%
jan 1, 2006
4.01 mln
-22.795 mln
-85.04%
jan 1, 2007
-11.672 mln
-15.682 mln
-391.04%
jan 1, 2008
16.578 mln
+28.25 mln
-242.03%
jan 1, 2009
28.949 mln
+12.371 mln
74.62%
jan 1, 2010
71.715 mln
+42.766 mln
147.73%
jan 1, 2011
-5.192 mln
-76.906 mln
-107.24%
jan 1, 2012
98.069 mln
+103.261 mln
-1.99K%
jan 1, 2013
91.225 mln
-6.845 mln
-6.98%
jan 1, 2014
92.425 mln
+1.2 mln
1.32%
jan 1, 2015
76.46 mln
-15.965 mln
-17.27%
jan 1, 2016
94.956 mln
+18.496 mln
24.19%
Ranking of countries by current statistics by years


Comments: