29
/
en
AIzaSyAYiBZKx7MnpbEhh9jyipgxe19OcubqV5w
April 1, 2024
126230
El Salvador
SLV
true
2
1
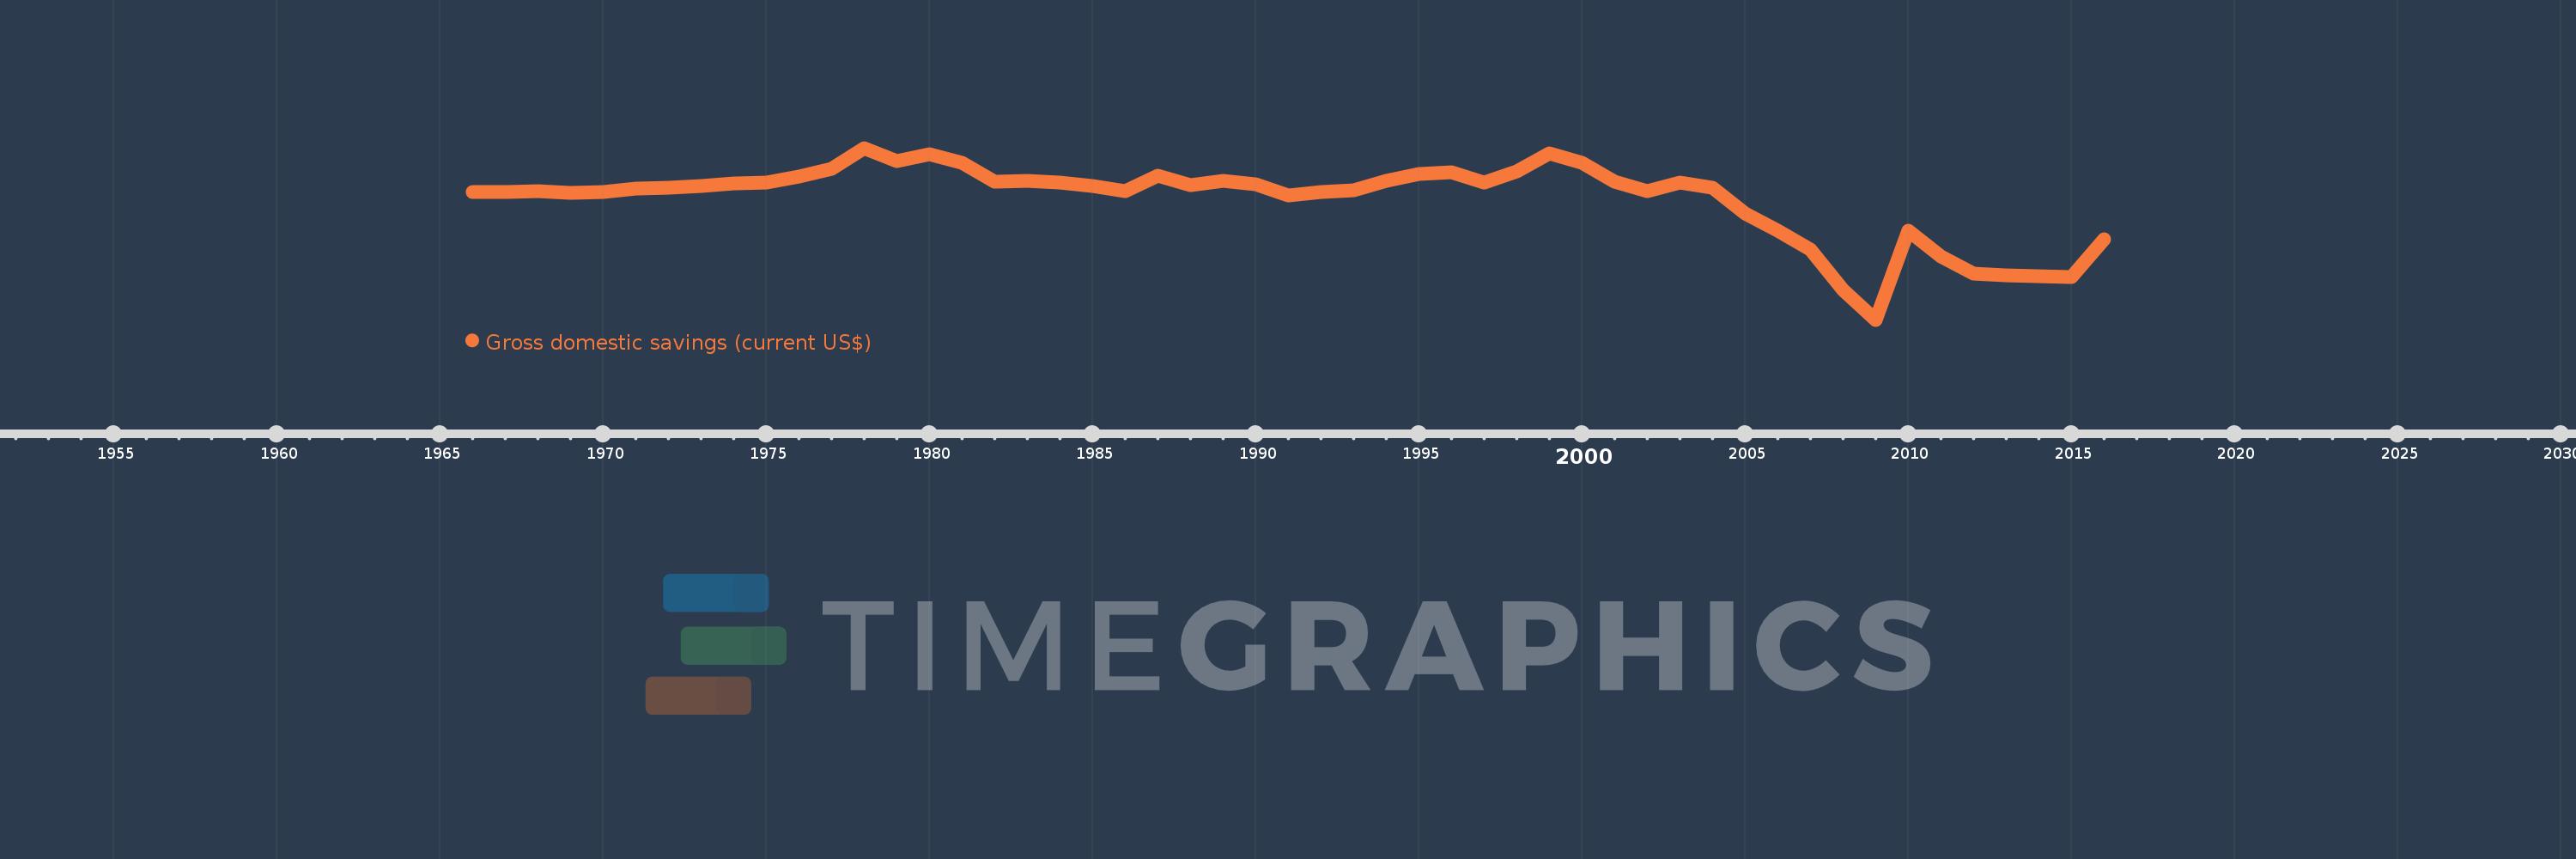
Gross domestic savings (current US$)
2016,2015,2014,2013,2012,2011,2010,2009,2008,2007,2006,2005,2004,2003,2002,2001,2000,1999,1998,1997,1996,1995,1994,1993,1992,1991,1990,1989,1988,1987,1986,1985,1984,1983,1982,1981,1980,1979,1978,1977,1976,1975,1974,1973,1972,1971,1970,1969,1968,1967,1966
This statistics in other country:
AfghanistanAlbaniaAlgeriaAngolaAntigua and BarbudaArab WorldArgentinaArmeniaArubaAustraliaAustriaAzerbaijanBahamas, TheBahrainBangladeshBarbadosBelarusBelgiumBelizeBeninBermudaBhutanBoliviaBosnia and HerzegovinaBotswanaBrazilBrunei DarussalamBulgariaBurkina FasoBurundiCabo VerdeCambodiaCameroonCanadaCaribbean small statesCentral African RepublicCentral Europe and the BalticsChadChileChinaColombiaComorosCongo, Dem. Rep.Congo, Rep.Costa RicaCote d'IvoireCroatiaCubaCyprusCzech RepublicDenmarkDjiboutiDominicaDominican RepublicEarly-demographic dividendEast Asia & PacificEast Asia & Pacific (excluding high income)East Asia & Pacific (IDA & IBRD countries)EcuadorEgypt, Arab Rep.El SalvadorEquatorial GuineaEritreaEstoniaEthiopiaEuro areaEurope & Central AsiaEurope & Central Asia (excluding high income)Europe & Central Asia (IDA & IBRD countries)European UnionFaroe IslandsFijiFinlandFragile and conflict affected situationsFranceGabonGambia, TheGeorgiaGermanyGhanaGreeceGrenadaGuatemalaGuineaGuinea-BissauGuyanaHaitiHeavily indebted poor countries (HIPC)High incomeHondurasHong Kong SAR, ChinaHungaryIBRD onlyIcelandIDA & IBRD totalIDA blendIDA onlyIDA totalIndiaIndonesiaIran, Islamic Rep.IraqIrelandIsraelItalyJamaicaJapanJordanKazakhstanKenyaKiribatiKorea, Rep.KosovoKuwaitKyrgyz RepublicLao PDRLate-demographic dividendLatin America & Caribbean Latin America & Caribbean (excluding high income)Latin America & the Caribbean (IDA & IBRD countries)LatviaLeast developed countries: UN classificationLebanonLesothoLiberiaLibyaLithuaniaLow & middle incomeLow incomeLower middle incomeLuxembourgMacao SAR, ChinaMacedonia, FYRMadagascarMalawiMalaysiaMaldivesMaliMaltaMauritaniaMauritiusMexicoMicronesia, Fed. Sts.Middle East & North AfricaMiddle East & North Africa (excluding high income)Middle East & North Africa (IDA & IBRD countries)Middle incomeMoldovaMongoliaMontenegroMoroccoMozambiqueNamibiaNepalNetherlandsNew CaledoniaNew ZealandNicaraguaNigerNigeriaNorth AmericaNorwayOECD membersOmanOther small statesPakistanPanamaPapua New GuineaParaguayPeruPhilippinesPolandPortugalPost-demographic dividendPre-demographic dividendPuerto RicoQatarRomaniaRussian FederationRwandaSaudi ArabiaSenegalSerbiaSeychellesSierra LeoneSingaporeSlovak RepublicSloveniaSmall statesSolomon IslandsSouth AfricaSouth AsiaSouth Asia (IDA & IBRD)South SudanSpainSri LankaSt. Kitts and NevisSt. LuciaSt. Vincent and the GrenadinesSub-Saharan Africa Sub-Saharan Africa (excluding high income)Sub-Saharan Africa (IDA & IBRD countries)SudanSurinameSwazilandSwedenSwitzerlandSyrian Arab RepublicTajikistanTanzaniaThailandTimor-LesteTogoTongaTrinidad and TobagoTunisiaTurkeyTurkmenistanUgandaUkraineUnited Arab EmiratesUnited KingdomUnited StatesUpper middle incomeUruguayUzbekistanVanuatuVenezuela, RBVietnamWest Bank and GazaWorldYemen, Rep.ZambiaZimbabwe Timeline:
This timeline shows a graph from 1966 to 2016 of El Salvador. No data until 1965. Number of actual observations by date: 51.
Source name:
World Development Indicators
Source organization:
World Bank national accounts data, and OECD National Accounts data files.
Categories, topics:
Economy & Growth
Last updated:
apr 23, 2017
Indicators value changes by year
Minimum:
-1.632 bln
jan 1, 2009
Maximum:
709.16 mln
jan 1, 1978
At the date of observation
Value
Absolute change
Change from previous value
jan 1, 1966
111.96 mln
+111.96 mln
0.0%
jan 1, 1967
106.52 mln
-5.44 mln
-4.86%
jan 1, 1968
114.72 mln
+8.2 mln
7.7%
jan 1, 1969
98.8 mln
-15.92 mln
-13.88%
jan 1, 1970
110.24 mln
+11.44 mln
11.58%
jan 1, 1971
153.32 mln
+43.08 mln
39.08%
jan 1, 1972
161.44 mln
+8.12 mln
5.3%
jan 1, 1973
191.24 mln
+29.8 mln
18.46%
jan 1, 1974
220.04 mln
+28.8 mln
15.06%
jan 1, 1975
236.76 mln
+16.72 mln
7.6%
jan 1, 1976
319.4 mln
+82.64 mln
34.9%
jan 1, 1977
427.16 mln
+107.76 mln
33.74%
jan 1, 1978
709.16 mln
+282.0 mln
66.02%
jan 1, 1979
525.84 mln
-183.32 mln
-25.85%
jan 1, 1980
620.52 mln
+94.68 mln
18.01%
jan 1, 1981
507.16 mln
-113.36 mln
-18.27%
jan 1, 1982
252.12 mln
-255.04 mln
-50.29%
jan 1, 1983
255.907 mln
+3.787 mln
1.5%
jan 1, 1984
232.624 mln
-23.283 mln
-9.1%
jan 1, 1985
189.604 mln
-43.02 mln
-18.49%
jan 1, 1986
124.759 mln
-64.845 mln
-34.2%
jan 1, 1987
334.674 mln
+209.915 mln
168.26%
jan 1, 1988
207.854 mln
-126.819 mln
-37.89%
jan 1, 1989
264.692 mln
+56.837 mln
27.34%
jan 1, 1990
213.138 mln
-51.553 mln
-19.48%
jan 1, 1991
57.1 mln
-156.038 mln
-73.21%
jan 1, 1992
111.6 mln
+54.5 mln
95.45%
jan 1, 1993
130.0 mln
+18.4 mln
16.49%
jan 1, 1994
265.6 mln
+135.6 mln
104.31%
jan 1, 1995
359.9 mln
+94.3 mln
35.5%
jan 1, 1996
372.8 mln
+12.9 mln
3.58%
jan 1, 1997
240.5 mln
-132.3 mln
-35.49%
jan 1, 1998
385.0 mln
+144.5 mln
60.08%
jan 1, 1999
631.7 mln
+246.7 mln
64.08%
jan 1, 2000
508.7 mln
-123.0 mln
-19.47%
jan 1, 2001
248.6 mln
-260.1 mln
-51.13%
jan 1, 2002
119.9 mln
-128.7 mln
-51.77%
jan 1, 2003
239.9 mln
+120.0 mln
100.08%
jan 1, 2004
161.7 mln
-78.2 mln
-32.6%
jan 1, 2005
-179.4 mln
-341.1 mln
-210.95%
jan 1, 2006
-417.0 mln
-237.6 mln
132.44%
jan 1, 2007
-678.1 mln
-261.1 mln
62.61%
jan 1, 2008
-1.226 bln
-548.4 mln
80.87%
jan 1, 2009
-1.632 bln
-405.7 mln
33.08%
jan 1, 2010
-422.3 mln
+1.21 bln
-74.13%
jan 1, 2011
-771.4 mln
-349.1 mln
82.67%
jan 1, 2012
-999.9 mln
-228.5 mln
29.62%
jan 1, 2013
-1.027 bln
-26.9 mln
2.69%
jan 1, 2014
-1.034 bln
-7.2 mln
0.7%
jan 1, 2015
-1.053 bln
-18.6 mln
1.8%
jan 1, 2016
-539.8 mln
+512.8 mln
-48.72%
Ranking of countries by current statistics by years


Comments: