29
/
en
AIzaSyAYiBZKx7MnpbEhh9jyipgxe19OcubqV5w
April 1, 2024
238309
Seychelles
SYC
true
2
1
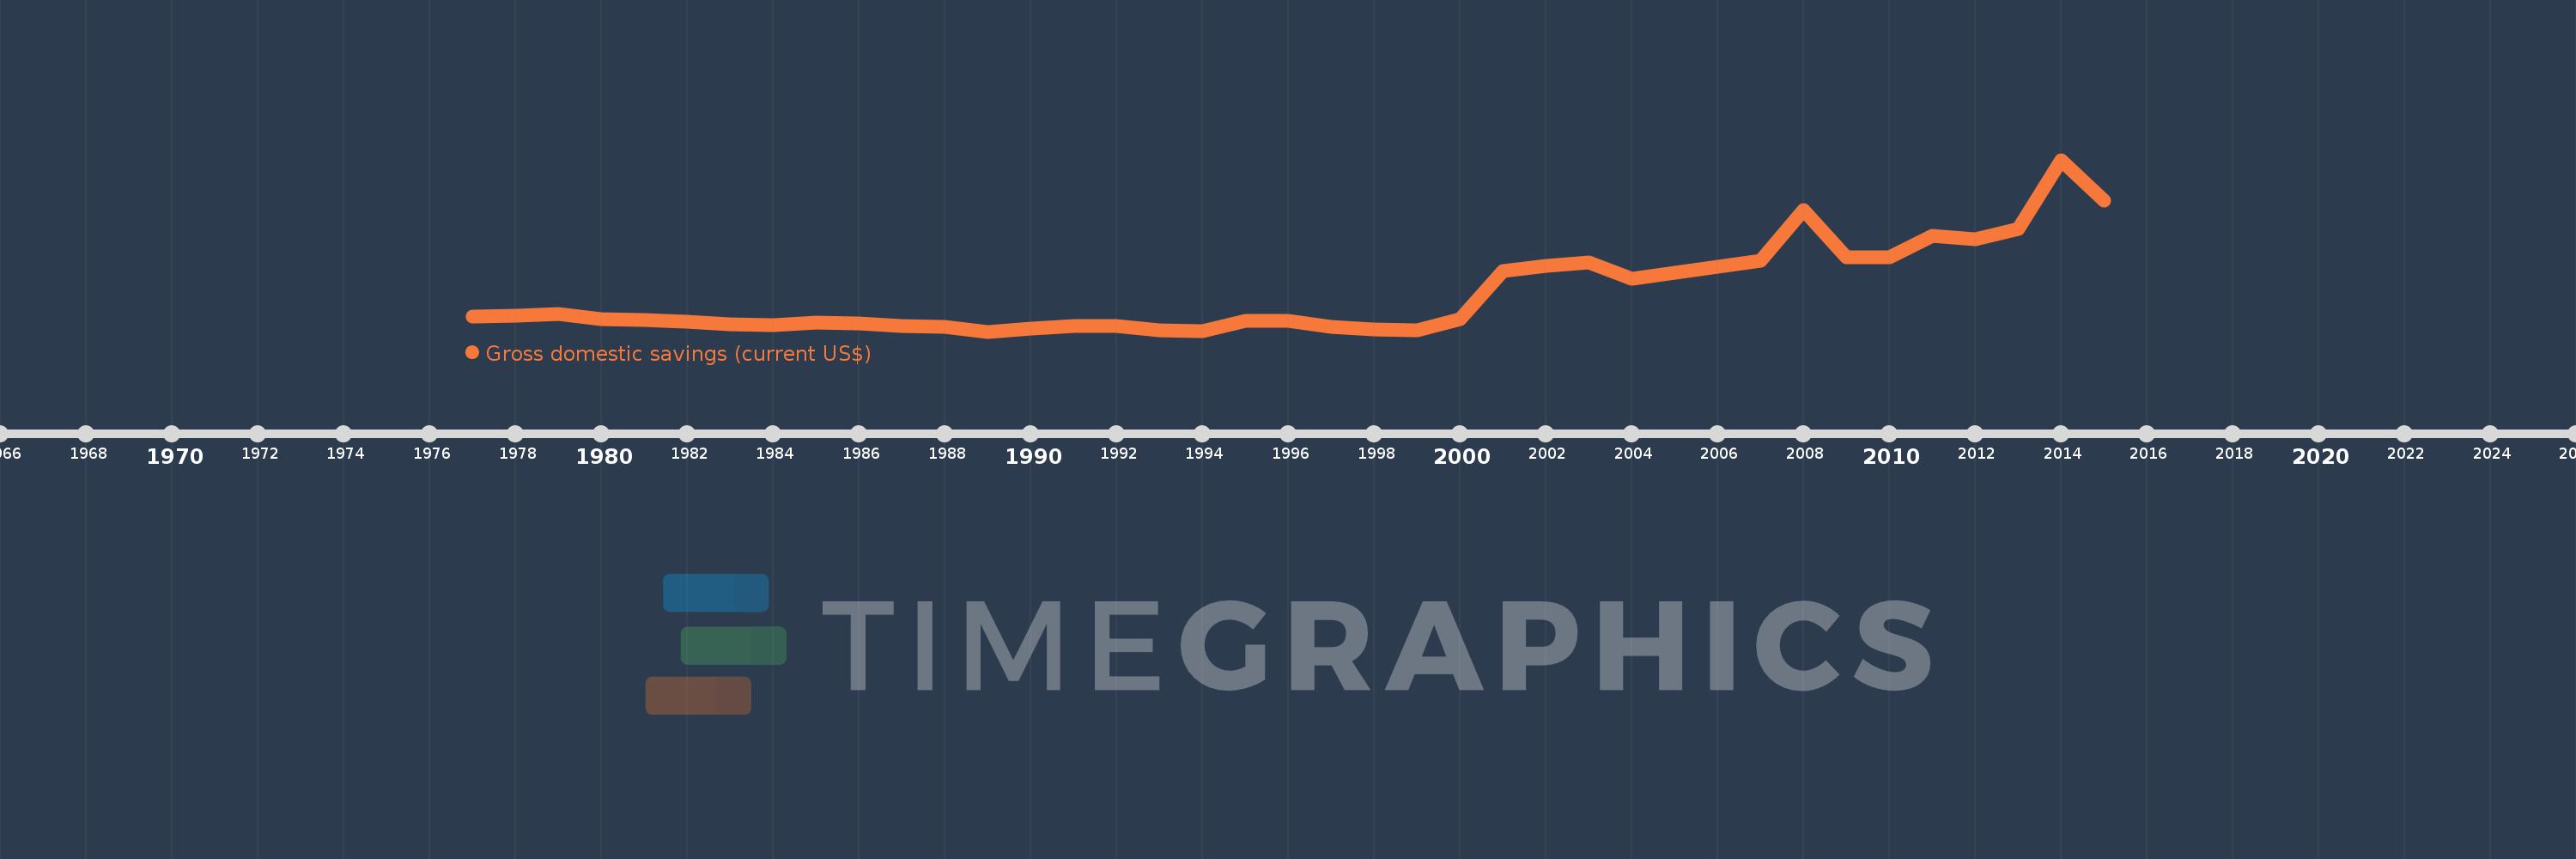
Gross domestic savings (current US$)
2015,2014,2013,2012,2011,2010,2009,2008,2007,2004,2003,2002,2001,2000,1999,1998,1997,1996,1995,1994,1993,1992,1991,1990,1989,1988,1987,1986,1985,1984,1983,1982,1981,1980,1979,1978,1977
This statistics in other country:
AfghanistanAlbaniaAlgeriaAngolaAntigua and BarbudaArab WorldArgentinaArmeniaArubaAustraliaAustriaAzerbaijanBahamas, TheBahrainBangladeshBarbadosBelarusBelgiumBelizeBeninBermudaBhutanBoliviaBosnia and HerzegovinaBotswanaBrazilBrunei DarussalamBulgariaBurkina FasoBurundiCabo VerdeCambodiaCameroonCanadaCaribbean small statesCentral African RepublicCentral Europe and the BalticsChadChileChinaColombiaComorosCongo, Dem. Rep.Congo, Rep.Costa RicaCote d'IvoireCroatiaCubaCyprusCzech RepublicDenmarkDjiboutiDominicaDominican RepublicEarly-demographic dividendEast Asia & PacificEast Asia & Pacific (excluding high income)East Asia & Pacific (IDA & IBRD countries)EcuadorEgypt, Arab Rep.El SalvadorEquatorial GuineaEritreaEstoniaEthiopiaEuro areaEurope & Central AsiaEurope & Central Asia (excluding high income)Europe & Central Asia (IDA & IBRD countries)European UnionFaroe IslandsFijiFinlandFragile and conflict affected situationsFranceGabonGambia, TheGeorgiaGermanyGhanaGreeceGrenadaGuatemalaGuineaGuinea-BissauGuyanaHaitiHeavily indebted poor countries (HIPC)High incomeHondurasHong Kong SAR, ChinaHungaryIBRD onlyIcelandIDA & IBRD totalIDA blendIDA onlyIDA totalIndiaIndonesiaIran, Islamic Rep.IraqIrelandIsraelItalyJamaicaJapanJordanKazakhstanKenyaKiribatiKorea, Rep.KosovoKuwaitKyrgyz RepublicLao PDRLate-demographic dividendLatin America & Caribbean Latin America & Caribbean (excluding high income)Latin America & the Caribbean (IDA & IBRD countries)LatviaLeast developed countries: UN classificationLebanonLesothoLiberiaLibyaLithuaniaLow & middle incomeLow incomeLower middle incomeLuxembourgMacao SAR, ChinaMacedonia, FYRMadagascarMalawiMalaysiaMaldivesMaliMaltaMauritaniaMauritiusMexicoMicronesia, Fed. Sts.Middle East & North AfricaMiddle East & North Africa (excluding high income)Middle East & North Africa (IDA & IBRD countries)Middle incomeMoldovaMongoliaMontenegroMoroccoMozambiqueNamibiaNepalNetherlandsNew CaledoniaNew ZealandNicaraguaNigerNigeriaNorth AmericaNorwayOECD membersOmanOther small statesPakistanPanamaPapua New GuineaParaguayPeruPhilippinesPolandPortugalPost-demographic dividendPre-demographic dividendPuerto RicoQatarRomaniaRussian FederationRwandaSaudi ArabiaSenegalSerbiaSeychellesSierra LeoneSingaporeSlovak RepublicSloveniaSmall statesSolomon IslandsSouth AfricaSouth AsiaSouth Asia (IDA & IBRD)South SudanSpainSri LankaSt. Kitts and NevisSt. LuciaSt. Vincent and the GrenadinesSub-Saharan Africa Sub-Saharan Africa (excluding high income)Sub-Saharan Africa (IDA & IBRD countries)SudanSurinameSwazilandSwedenSwitzerlandSyrian Arab RepublicTajikistanTanzaniaThailandTimor-LesteTogoTongaTrinidad and TobagoTunisiaTurkeyTurkmenistanUgandaUkraineUnited Arab EmiratesUnited KingdomUnited StatesUpper middle incomeUruguayUzbekistanVanuatuVenezuela, RBVietnamWest Bank and GazaWorldYemen, Rep.ZambiaZimbabwe Timeline:
This timeline shows a graph from 1977 to 2015 of Seychelles. No data until 1976. Number of actual observations by date: 37.
Source name:
World Development Indicators
Source organization:
World Bank national accounts data, and OECD National Accounts data files.
Categories, topics:
Economy & Growth
Last updated:
apr 23, 2017
Indicators value changes by year
Minimum:
-54.798 mln
jan 1, 1989
Maximum:
430.803 mln
jan 1, 2014
At the date of observation
Value
Absolute change
Change from previous value
jan 1, 1977
-11.319 mln
-11.319 mln
0.0%
jan 1, 1978
-8.855 mln
+2.464 mln
-21.77%
jan 1, 1979
-5.627 mln
+3.228 mln
-36.45%
jan 1, 1980
-20.632 mln
-15.005 mln
266.65%
jan 1, 1981
-21.172 mln
-540.291K
2.62%
jan 1, 1982
-25.902 mln
-4.73 mln
22.34%
jan 1, 1983
-34.801 mln
-8.899 mln
34.36%
jan 1, 1984
-36.414 mln
-1.612 mln
4.63%
jan 1, 1985
-29.149 mln
+7.265 mln
-19.95%
jan 1, 1986
-32.453 mln
-3.304 mln
11.33%
jan 1, 1987
-39.764 mln
-7.311 mln
22.53%
jan 1, 1988
-41.772 mln
-2.008 mln
5.05%
jan 1, 1989
-54.798 mln
-13.026 mln
31.18%
jan 1, 1990
-46.785 mln
+8.013 mln
-14.62%
jan 1, 1991
-39.138 mln
+7.648 mln
-16.35%
jan 1, 1992
-39.77 mln
-632.211K
1.62%
jan 1, 1993
-51.564 mln
-11.794 mln
29.66%
jan 1, 1994
-52.617 mln
-1.053 mln
2.04%
jan 1, 1995
-23.971 mln
+28.647 mln
-54.44%
jan 1, 1996
-25.536 mln
-1.566 mln
6.53%
jan 1, 1997
-42.506 mln
-16.97 mln
66.46%
jan 1, 1998
-47.551 mln
-5.044 mln
11.87%
jan 1, 1999
-50.256 mln
-2.705 mln
5.69%
jan 1, 2000
-19.171 mln
+31.086 mln
-61.85%
jan 1, 2001
115.291 mln
+134.462 mln
-701.39%
jan 1, 2002
129.748 mln
+14.457 mln
12.54%
jan 1, 2003
140.212 mln
+10.464 mln
8.07%
jan 1, 2004
93.635 mln
-46.577 mln
-33.22%
jan 1, 2007
145.154 mln
+51.519 mln
55.02%
jan 1, 2008
287.677 mln
+142.523 mln
98.19%
jan 1, 2009
156.405 mln
-131.272 mln
-45.63%
jan 1, 2010
154.598 mln
-1.807 mln
-1.16%
jan 1, 2011
216.706 mln
+62.108 mln
40.17%
jan 1, 2012
206.925 mln
-9.782 mln
-4.51%
jan 1, 2013
235.085 mln
+28.16 mln
13.61%
jan 1, 2014
430.803 mln
+195.718 mln
83.25%
jan 1, 2015
316.067 mln
-114.736 mln
-26.63%
Ranking of countries by current statistics by years


Comments: