29
/
en
AIzaSyAYiBZKx7MnpbEhh9jyipgxe19OcubqV5w
April 1, 2024
147990
Guyana
GUY
true
2
1
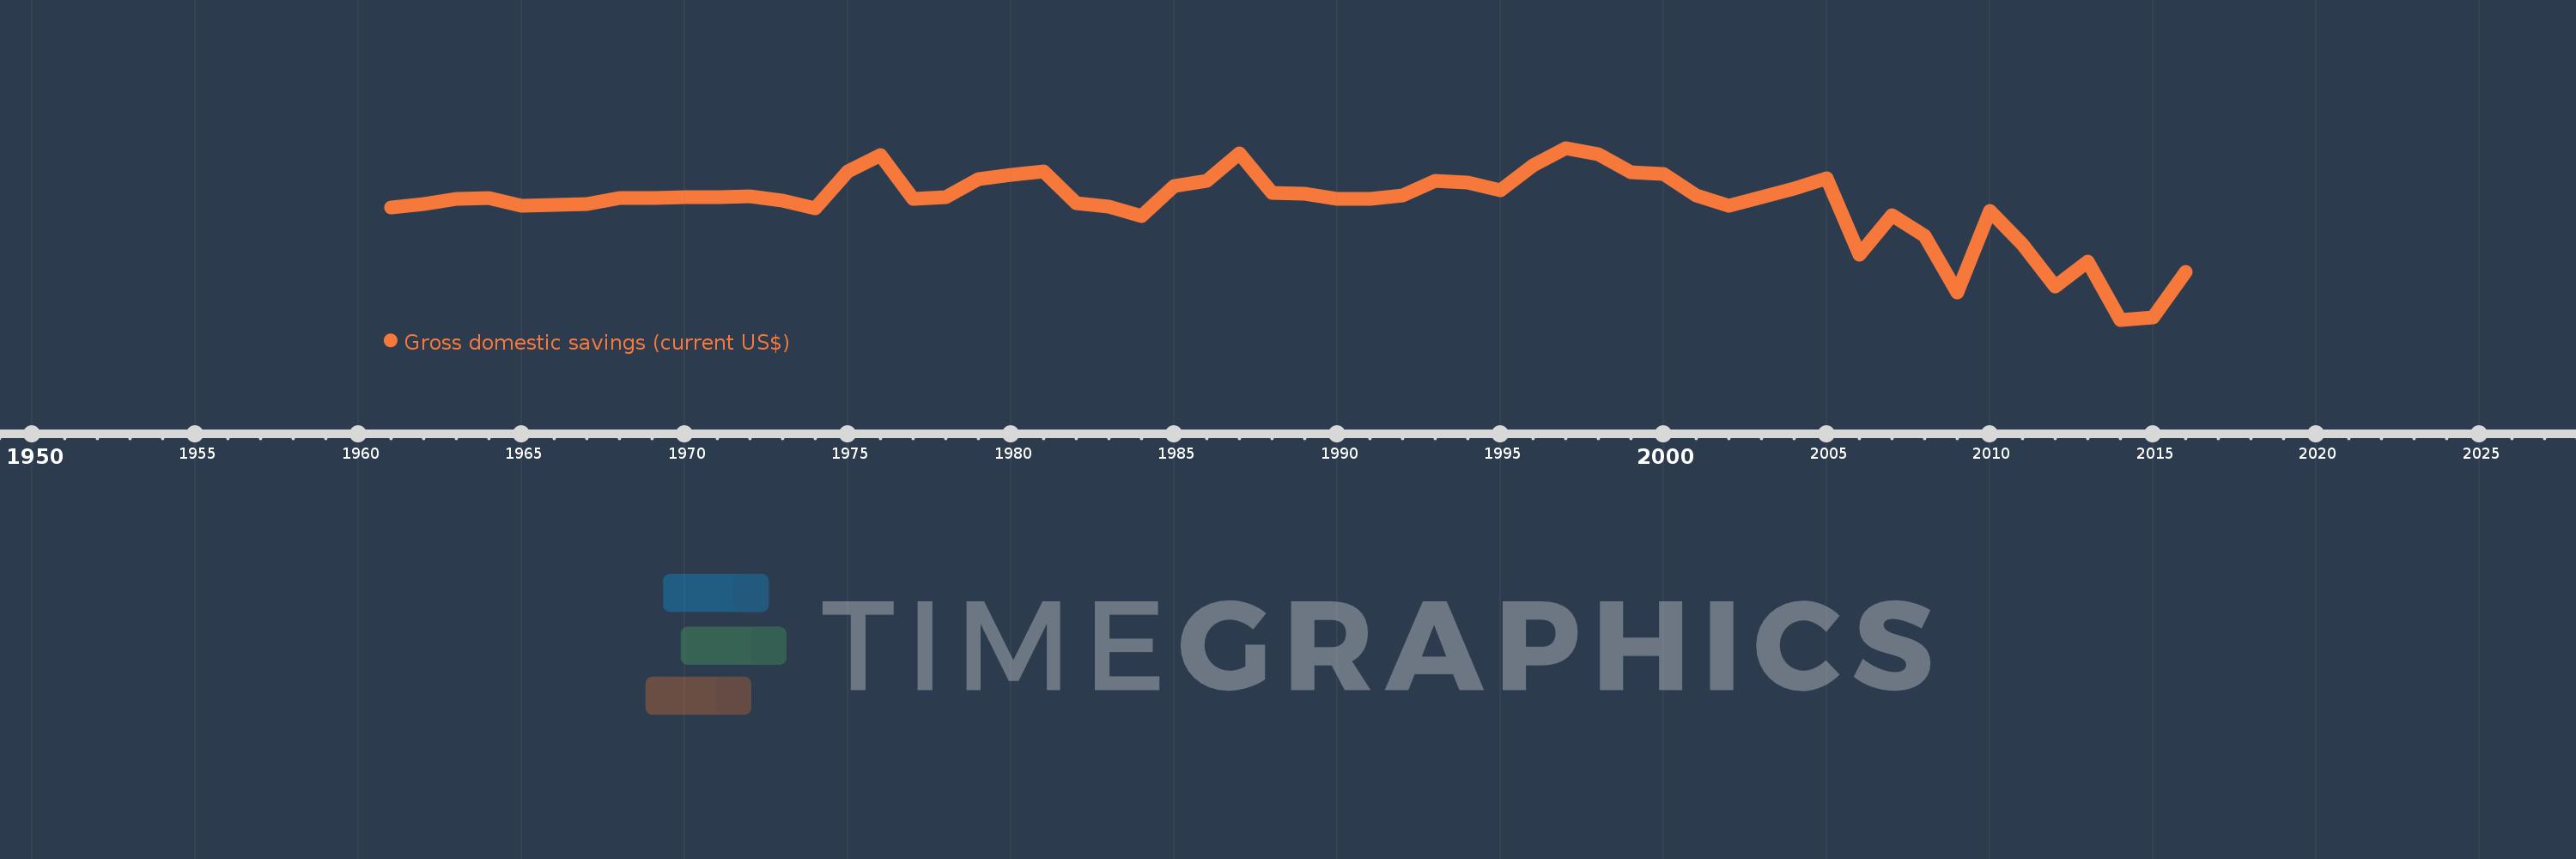
Gross domestic savings (current US$)
2016,2015,2014,2013,2012,2011,2010,2009,2008,2007,2006,2005,2004,2003,2002,2001,2000,1999,1998,1997,1996,1995,1994,1993,1992,1991,1990,1989,1988,1987,1986,1985,1984,1983,1982,1981,1980,1979,1978,1977,1976,1975,1974,1973,1972,1971,1970,1969,1968,1967,1966,1965,1964,1963,1962,1961
This statistics in other country:
AfghanistanAlbaniaAlgeriaAngolaAntigua and BarbudaArab WorldArgentinaArmeniaArubaAustraliaAustriaAzerbaijanBahamas, TheBahrainBangladeshBarbadosBelarusBelgiumBelizeBeninBermudaBhutanBoliviaBosnia and HerzegovinaBotswanaBrazilBrunei DarussalamBulgariaBurkina FasoBurundiCabo VerdeCambodiaCameroonCanadaCaribbean small statesCentral African RepublicCentral Europe and the BalticsChadChileChinaColombiaComorosCongo, Dem. Rep.Congo, Rep.Costa RicaCote d'IvoireCroatiaCubaCyprusCzech RepublicDenmarkDjiboutiDominicaDominican RepublicEarly-demographic dividendEast Asia & PacificEast Asia & Pacific (excluding high income)East Asia & Pacific (IDA & IBRD countries)EcuadorEgypt, Arab Rep.El SalvadorEquatorial GuineaEritreaEstoniaEthiopiaEuro areaEurope & Central AsiaEurope & Central Asia (excluding high income)Europe & Central Asia (IDA & IBRD countries)European UnionFaroe IslandsFijiFinlandFragile and conflict affected situationsFranceGabonGambia, TheGeorgiaGermanyGhanaGreeceGrenadaGuatemalaGuineaGuinea-BissauGuyanaHaitiHeavily indebted poor countries (HIPC)High incomeHondurasHong Kong SAR, ChinaHungaryIBRD onlyIcelandIDA & IBRD totalIDA blendIDA onlyIDA totalIndiaIndonesiaIran, Islamic Rep.IraqIrelandIsraelItalyJamaicaJapanJordanKazakhstanKenyaKiribatiKorea, Rep.KosovoKuwaitKyrgyz RepublicLao PDRLate-demographic dividendLatin America & Caribbean Latin America & Caribbean (excluding high income)Latin America & the Caribbean (IDA & IBRD countries)LatviaLeast developed countries: UN classificationLebanonLesothoLiberiaLibyaLithuaniaLow & middle incomeLow incomeLower middle incomeLuxembourgMacao SAR, ChinaMacedonia, FYRMadagascarMalawiMalaysiaMaldivesMaliMaltaMauritaniaMauritiusMexicoMicronesia, Fed. Sts.Middle East & North AfricaMiddle East & North Africa (excluding high income)Middle East & North Africa (IDA & IBRD countries)Middle incomeMoldovaMongoliaMontenegroMoroccoMozambiqueNamibiaNepalNetherlandsNew CaledoniaNew ZealandNicaraguaNigerNigeriaNorth AmericaNorwayOECD membersOmanOther small statesPakistanPanamaPapua New GuineaParaguayPeruPhilippinesPolandPortugalPost-demographic dividendPre-demographic dividendPuerto RicoQatarRomaniaRussian FederationRwandaSaudi ArabiaSenegalSerbiaSeychellesSierra LeoneSingaporeSlovak RepublicSloveniaSmall statesSolomon IslandsSouth AfricaSouth AsiaSouth Asia (IDA & IBRD)South SudanSpainSri LankaSt. Kitts and NevisSt. LuciaSt. Vincent and the GrenadinesSub-Saharan Africa Sub-Saharan Africa (excluding high income)Sub-Saharan Africa (IDA & IBRD countries)SudanSurinameSwazilandSwedenSwitzerlandSyrian Arab RepublicTajikistanTanzaniaThailandTimor-LesteTogoTongaTrinidad and TobagoTunisiaTurkeyTurkmenistanUgandaUkraineUnited Arab EmiratesUnited KingdomUnited StatesUpper middle incomeUruguayUzbekistanVanuatuVenezuela, RBVietnamWest Bank and GazaWorldYemen, Rep.ZambiaZimbabwe Timeline:
This timeline shows a graph from 1961 to 2016 of Guyana. No data until 1960. Number of actual observations by date: 56.
Source name:
World Development Indicators
Source organization:
World Bank national accounts data, and OECD National Accounts data files.
Categories, topics:
Economy & Growth
Last updated:
apr 23, 2017
Indicators value changes by year
Minimum:
-241.862 mln
jan 1, 2014
Maximum:
181.729 mln
jan 1, 1997
At the date of observation
Value
Absolute change
Change from previous value
jan 1, 1961
34.125 mln
+34.125 mln
0.0%
jan 1, 1962
42.875 mln
+8.75 mln
25.64%
jan 1, 1963
55.358 mln
+12.483 mln
29.12%
jan 1, 1964
59.208 mln
+3.85 mln
6.95%
jan 1, 1965
38.266 mln
-20.941 mln
-35.37%
jan 1, 1966
42.294 mln
+4.028 mln
10.53%
jan 1, 1967
42.765 mln
+470.588K
1.11%
jan 1, 1968
58.706 mln
+15.941 mln
37.28%
jan 1, 1969
58.25 mln
-455.882K
-0.78%
jan 1, 1970
61.4 mln
+3.15 mln
5.41%
jan 1, 1971
59.5 mln
-1.9 mln
-3.09%
jan 1, 1972
63.05 mln
+3.55 mln
5.97%
jan 1, 1973
52.905 mln
-10.145 mln
-16.09%
jan 1, 1974
32.286 mln
-20.619 mln
-38.97%
jan 1, 1975
122.955 mln
+90.669 mln
280.83%
jan 1, 1976
163.458 mln
+40.504 mln
32.94%
jan 1, 1977
56.92 mln
-106.538 mln
-65.18%
jan 1, 1978
60.8 mln
+3.88 mln
6.82%
jan 1, 1979
103.92 mln
+43.12 mln
70.92%
jan 1, 1980
114.44 mln
+10.52 mln
10.12%
jan 1, 1981
123.08 mln
+8.64 mln
7.55%
jan 1, 1982
45.536 mln
-77.544 mln
-63.0%
jan 1, 1983
36.933 mln
-8.602 mln
-18.89%
jan 1, 1984
13.167 mln
-23.767 mln
-64.35%
jan 1, 1985
88.5 mln
+75.333 mln
572.15%
jan 1, 1986
99.767 mln
+11.267 mln
12.73%
jan 1, 1987
167.698 mln
+67.93 mln
68.09%
jan 1, 1988
70.612 mln
-97.085 mln
-57.89%
jan 1, 1989
69.7 mln
-912.255K
-1.29%
jan 1, 1990
57.132 mln
-12.568 mln
-18.03%
jan 1, 1991
55.443 mln
-1.689 mln
-2.96%
jan 1, 1992
64.088 mln
+8.645 mln
15.59%
jan 1, 1993
100.336 mln
+36.249 mln
56.56%
jan 1, 1994
95.812 mln
-4.525 mln
-4.51%
jan 1, 1995
77.047 mln
-18.765 mln
-19.59%
jan 1, 1996
138.764 mln
+61.717 mln
80.1%
jan 1, 1997
181.729 mln
+42.965 mln
30.96%
jan 1, 1998
165.345 mln
-16.384 mln
-9.02%
jan 1, 1999
121.572 mln
-43.773 mln
-26.47%
jan 1, 2000
117.8 mln
-3.772 mln
-3.1%
jan 1, 2001
65.333 mln
-52.467 mln
-44.54%
jan 1, 2002
39.249 mln
-26.083 mln
-39.92%
jan 1, 2003
59.806 mln
+20.557 mln
52.38%
jan 1, 2004
81.665 mln
+21.859 mln
36.55%
jan 1, 2005
107.971 mln
+26.306 mln
32.21%
jan 1, 2006
-80.829 mln
-188.8 mln
-174.86%
jan 1, 2007
15.57 mln
+96.399 mln
-119.26%
jan 1, 2008
-35.108 mln
-50.678 mln
-325.48%
jan 1, 2009
-174.137 mln
-139.028 mln
396.0%
jan 1, 2010
25.565 mln
+199.702 mln
-114.68%
jan 1, 2011
-56.429 mln
-81.994 mln
-320.73%
jan 1, 2012
-160.692 mln
-104.263 mln
184.77%
jan 1, 2013
-98.337 mln
+62.355 mln
-38.8%
jan 1, 2014
-241.862 mln
-143.525 mln
145.95%
jan 1, 2015
-236.063 mln
+5.799 mln
-2.4%
jan 1, 2016
-124.932 mln
+111.131 mln
-47.08%
Ranking of countries by current statistics by years


Comments: