29
/
en
AIzaSyAYiBZKx7MnpbEhh9jyipgxe19OcubqV5w
April 1, 2024
239338
Sierra Leone
SLE
true
2
1
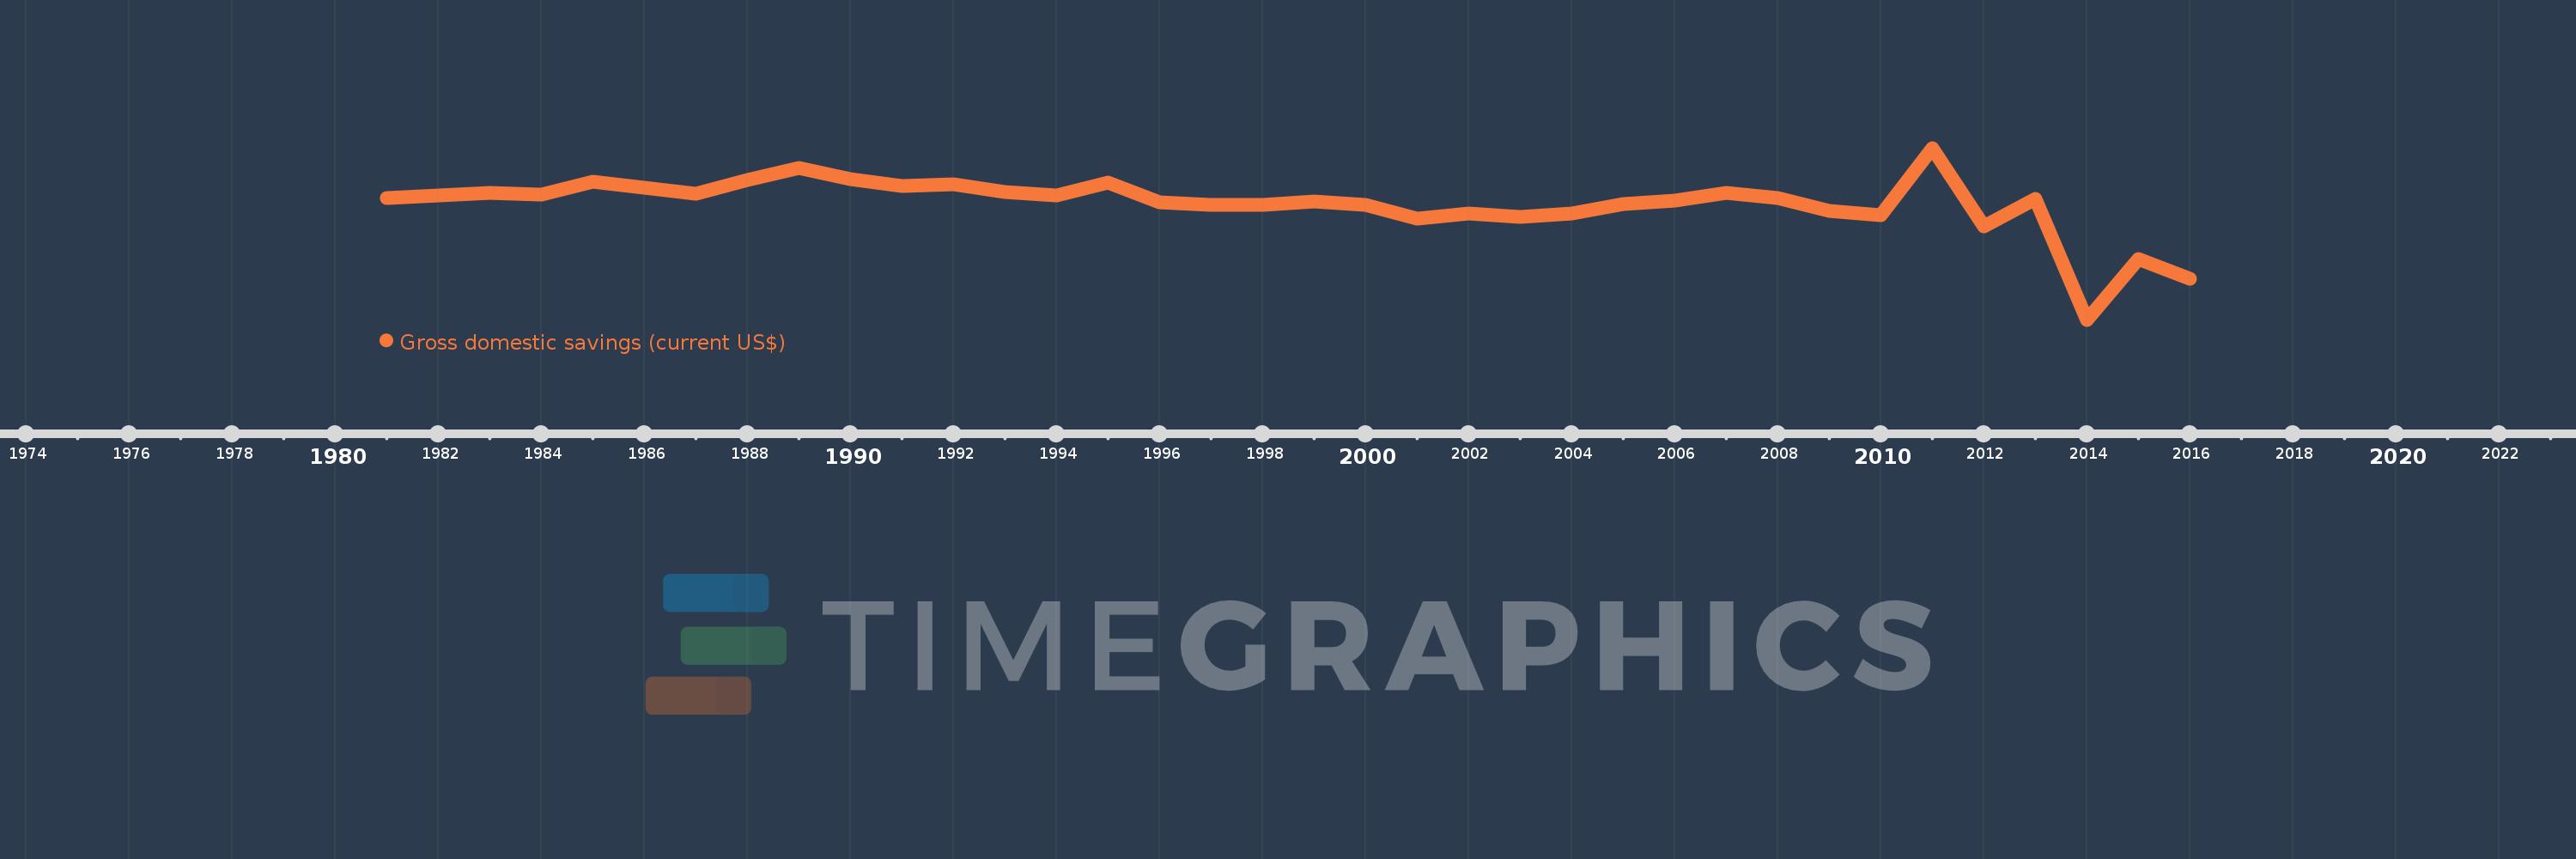
Gross domestic savings (current US$)
2016,2015,2014,2013,2012,2011,2010,2009,2008,2007,2006,2005,2004,2003,2002,2001,2000,1999,1998,1997,1996,1995,1994,1993,1992,1991,1990,1989,1988,1987,1986,1985,1984,1983,1982,1981
This statistics in other country:
AfghanistanAlbaniaAlgeriaAngolaAntigua and BarbudaArab WorldArgentinaArmeniaArubaAustraliaAustriaAzerbaijanBahamas, TheBahrainBangladeshBarbadosBelarusBelgiumBelizeBeninBermudaBhutanBoliviaBosnia and HerzegovinaBotswanaBrazilBrunei DarussalamBulgariaBurkina FasoBurundiCabo VerdeCambodiaCameroonCanadaCaribbean small statesCentral African RepublicCentral Europe and the BalticsChadChileChinaColombiaComorosCongo, Dem. Rep.Congo, Rep.Costa RicaCote d'IvoireCroatiaCubaCyprusCzech RepublicDenmarkDjiboutiDominicaDominican RepublicEarly-demographic dividendEast Asia & PacificEast Asia & Pacific (excluding high income)East Asia & Pacific (IDA & IBRD countries)EcuadorEgypt, Arab Rep.El SalvadorEquatorial GuineaEritreaEstoniaEthiopiaEuro areaEurope & Central AsiaEurope & Central Asia (excluding high income)Europe & Central Asia (IDA & IBRD countries)European UnionFaroe IslandsFijiFinlandFragile and conflict affected situationsFranceGabonGambia, TheGeorgiaGermanyGhanaGreeceGrenadaGuatemalaGuineaGuinea-BissauGuyanaHaitiHeavily indebted poor countries (HIPC)High incomeHondurasHong Kong SAR, ChinaHungaryIBRD onlyIcelandIDA & IBRD totalIDA blendIDA onlyIDA totalIndiaIndonesiaIran, Islamic Rep.IraqIrelandIsraelItalyJamaicaJapanJordanKazakhstanKenyaKiribatiKorea, Rep.KosovoKuwaitKyrgyz RepublicLao PDRLate-demographic dividendLatin America & Caribbean Latin America & Caribbean (excluding high income)Latin America & the Caribbean (IDA & IBRD countries)LatviaLeast developed countries: UN classificationLebanonLesothoLiberiaLibyaLithuaniaLow & middle incomeLow incomeLower middle incomeLuxembourgMacao SAR, ChinaMacedonia, FYRMadagascarMalawiMalaysiaMaldivesMaliMaltaMauritaniaMauritiusMexicoMicronesia, Fed. Sts.Middle East & North AfricaMiddle East & North Africa (excluding high income)Middle East & North Africa (IDA & IBRD countries)Middle incomeMoldovaMongoliaMontenegroMoroccoMozambiqueNamibiaNepalNetherlandsNew CaledoniaNew ZealandNicaraguaNigerNigeriaNorth AmericaNorwayOECD membersOmanOther small statesPakistanPanamaPapua New GuineaParaguayPeruPhilippinesPolandPortugalPost-demographic dividendPre-demographic dividendPuerto RicoQatarRomaniaRussian FederationRwandaSaudi ArabiaSenegalSerbiaSeychellesSierra LeoneSingaporeSlovak RepublicSloveniaSmall statesSolomon IslandsSouth AfricaSouth AsiaSouth Asia (IDA & IBRD)South SudanSpainSri LankaSt. Kitts and NevisSt. LuciaSt. Vincent and the GrenadinesSub-Saharan Africa Sub-Saharan Africa (excluding high income)Sub-Saharan Africa (IDA & IBRD countries)SudanSurinameSwazilandSwedenSwitzerlandSyrian Arab RepublicTajikistanTanzaniaThailandTimor-LesteTogoTongaTrinidad and TobagoTunisiaTurkeyTurkmenistanUgandaUkraineUnited Arab EmiratesUnited KingdomUnited StatesUpper middle incomeUruguayUzbekistanVanuatuVenezuela, RBVietnamWest Bank and GazaWorldYemen, Rep.ZambiaZimbabwe Timeline:
This timeline shows a graph from 1981 to 2016 of Sierra Leone. No data until 1980. Number of actual observations by date: 36.
Source name:
World Development Indicators
Source organization:
World Bank national accounts data, and OECD National Accounts data files.
Categories, topics:
Economy & Growth
Last updated:
apr 23, 2017
Indicators value changes by year
Minimum:
-808.805 mln
jan 1, 2014
Maximum:
345.493 mln
jan 1, 2011
At the date of observation
Value
Absolute change
Change from previous value
jan 1, 1981
9.43 mln
+9.43 mln
0.0%
jan 1, 1982
26.4 mln
+16.969 mln
179.94%
jan 1, 1983
41.497 mln
+15.097 mln
57.19%
jan 1, 1984
32.992 mln
-8.505 mln
-20.5%
jan 1, 1985
118.807 mln
+85.816 mln
260.11%
jan 1, 1986
78.288 mln
-40.519 mln
-34.1%
jan 1, 1987
36.975 mln
-41.313 mln
-52.77%
jan 1, 1988
132.978 mln
+96.003 mln
259.64%
jan 1, 1989
213.416 mln
+80.438 mln
60.49%
jan 1, 1990
135.957 mln
-77.459 mln
-36.29%
jan 1, 1991
88.969 mln
-46.988 mln
-34.56%
jan 1, 1992
102.673 mln
+13.704 mln
15.4%
jan 1, 1993
48.0 mln
-54.674 mln
-53.25%
jan 1, 1994
26.55 mln
-21.45 mln
-44.69%
jan 1, 1995
114.234 mln
+87.684 mln
330.26%
jan 1, 1996
-19.849 mln
-134.083 mln
-117.38%
jan 1, 1997
-34.553 mln
-14.704 mln
74.08%
jan 1, 1998
-36.585 mln
-2.032 mln
5.88%
jan 1, 1999
-12.749 mln
+23.836 mln
-65.15%
jan 1, 2000
-38.828 mln
-26.079 mln
204.56%
jan 1, 2001
-128.214 mln
-89.386 mln
230.21%
jan 1, 2002
-96.816 mln
+31.398 mln
-24.49%
jan 1, 2003
-120.512 mln
-23.696 mln
24.48%
jan 1, 2004
-94.735 mln
+25.777 mln
-21.39%
jan 1, 2005
-33.63 mln
+61.104 mln
-64.5%
jan 1, 2006
-7.049 mln
+26.582 mln
-79.04%
jan 1, 2007
41.411 mln
+48.46 mln
-687.5%
jan 1, 2008
7.882 mln
-33.53 mln
-80.97%
jan 1, 2009
-76.749 mln
-84.63 mln
-1.07K%
jan 1, 2010
-109.039 mln
-32.29 mln
42.07%
jan 1, 2011
345.493 mln
+454.532 mln
-416.85%
jan 1, 2012
-180.861 mln
-526.354 mln
-152.35%
jan 1, 2013
500.465K
+181.361 mln
-100.28%
jan 1, 2014
-808.805 mln
-809.305 mln
-161.71K%
jan 1, 2015
-400.039 mln
+408.766 mln
-50.54%
jan 1, 2016
-532.354 mln
-132.315 mln
33.08%
Ranking of countries by current statistics by years


Comments: