29
/
en
AIzaSyAYiBZKx7MnpbEhh9jyipgxe19OcubqV5w
April 1, 2024
86092
Bhutan
BTN
true
2
1
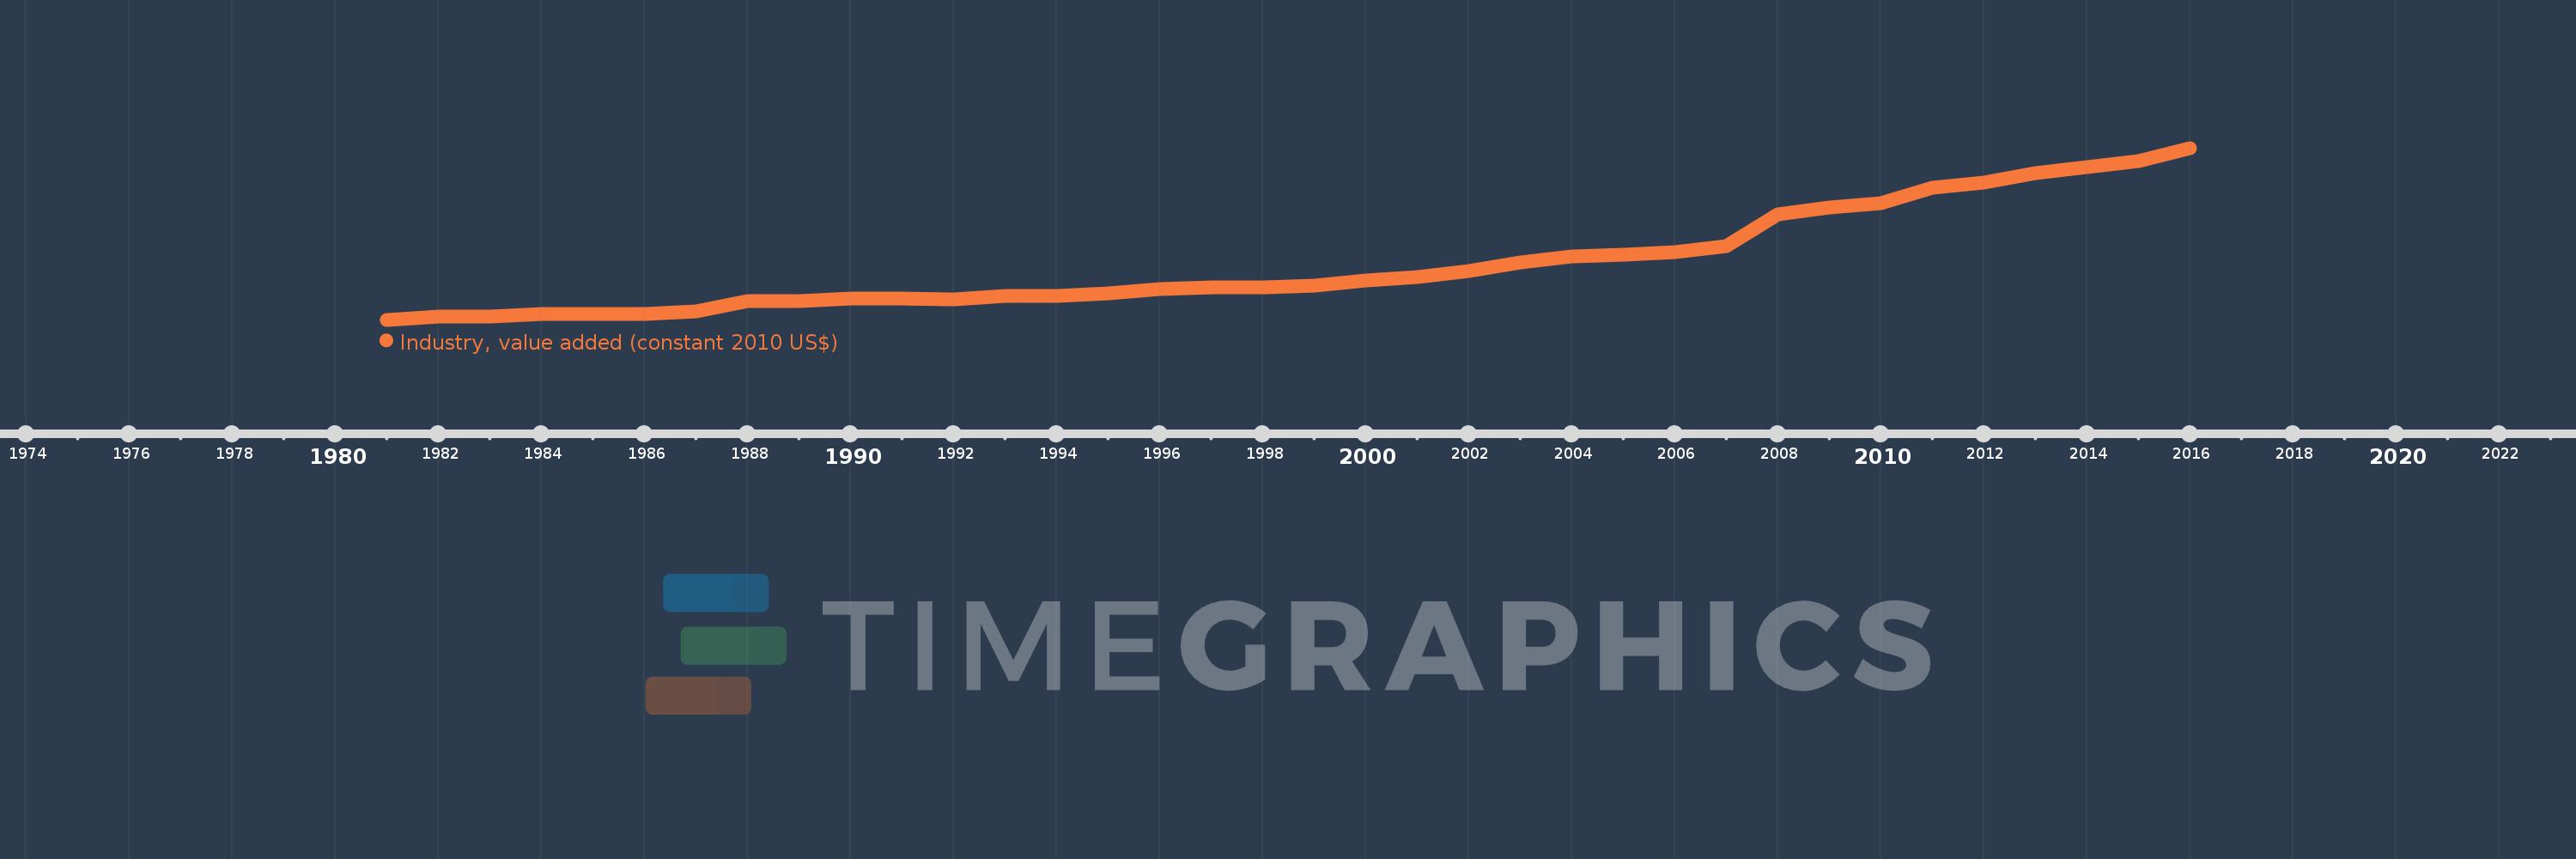
Industry, value added (constant 2010 US$)
2016,2015,2014,2013,2012,2011,2010,2009,2008,2007,2006,2005,2004,2003,2002,2001,2000,1999,1998,1997,1996,1995,1994,1993,1992,1991,1990,1989,1988,1987,1986,1985,1984,1983,1982,1981
This statistics in other country:
AfghanistanAlbaniaAlgeriaAndorraAntigua and BarbudaArab WorldArgentinaArmeniaArubaAustraliaAustriaAzerbaijanBahamas, TheBahrainBangladeshBarbadosBelarusBelgiumBelizeBeninBermudaBhutanBoliviaBosnia and HerzegovinaBotswanaBrazilBrunei DarussalamBulgariaBurkina FasoBurundiCabo VerdeCambodiaCameroonCanadaCaribbean small statesCentral African RepublicCentral Europe and the BalticsChadChileChinaColombiaComorosCongo, Dem. Rep.Congo, Rep.Costa RicaCote d'IvoireCroatiaCubaCyprusCzech RepublicDenmarkDominicaDominican RepublicEarly-demographic dividendEast Asia & PacificEast Asia & Pacific (excluding high income)East Asia & Pacific (IDA & IBRD countries)EcuadorEgypt, Arab Rep.El SalvadorEquatorial GuineaEstoniaEthiopiaEuro areaEurope & Central AsiaEurope & Central Asia (excluding high income)Europe & Central Asia (IDA & IBRD countries)European UnionFijiFinlandFragile and conflict affected situationsFranceGabonGambia, TheGeorgiaGermanyGhanaGreeceGrenadaGuatemalaGuineaGuinea-BissauGuyanaHeavily indebted poor countries (HIPC)High incomeHondurasHong Kong SAR, ChinaHungaryIBRD onlyIcelandIDA & IBRD totalIDA blendIDA onlyIDA totalIndiaIndonesiaIran, Islamic Rep.IraqIrelandItalyJamaicaJapanJordanKazakhstanKenyaKiribatiKorea, Rep.KosovoKuwaitKyrgyz RepublicLao PDRLate-demographic dividendLatin America & Caribbean Latin America & Caribbean (excluding high income)Latin America & the Caribbean (IDA & IBRD countries)LatviaLeast developed countries: UN classificationLebanonLesothoLiberiaLiechtensteinLithuaniaLow & middle incomeLow incomeLower middle incomeLuxembourgMacao SAR, ChinaMacedonia, FYRMadagascarMalawiMalaysiaMaldivesMaliMaltaMarshall IslandsMauritaniaMauritiusMexicoMicronesia, Fed. Sts.Middle East & North AfricaMiddle East & North Africa (excluding high income)Middle East & North Africa (IDA & IBRD countries)Middle incomeMoldovaMongoliaMontenegroMoroccoMozambiqueMyanmarNamibiaNepalNetherlandsNew ZealandNicaraguaNigerNigeriaNorth AmericaNorwayOECD membersOmanOther small statesPacific island small statesPakistanPalauPanamaParaguayPeruPhilippinesPolandPortugalPost-demographic dividendPre-demographic dividendPuerto RicoQatarRomaniaRussian FederationRwandaSamoaSao Tome and PrincipeSaudi ArabiaSenegalSerbiaSeychellesSierra LeoneSingaporeSlovak RepublicSloveniaSmall statesSouth AfricaSouth AsiaSouth Asia (IDA & IBRD)SpainSri LankaSt. Kitts and NevisSt. LuciaSt. Vincent and the GrenadinesSub-Saharan Africa Sub-Saharan Africa (excluding high income)Sub-Saharan Africa (IDA & IBRD countries)SudanSurinameSwazilandSwedenSwitzerlandTajikistanTanzaniaThailandTimor-LesteTogoTongaTrinidad and TobagoTunisiaTurkeyTurkmenistanTuvaluUgandaUkraineUnited Arab EmiratesUnited KingdomUnited StatesUpper middle incomeUruguayUzbekistanVanuatuVenezuela, RBVietnamWest Bank and GazaWorldYemen, Rep.ZambiaZimbabwe Timeline:
This timeline shows a graph from 1981 to 2016 of Bhutan. No data until 1980. Number of actual observations by date: 36.
Source name:
World Development Indicators
Source organization:
World Bank national accounts data, and OECD National Accounts data files.
Categories, topics:
Economy & Growth
Last updated:
apr 23, 2017
Indicators value changes by year
Minimum:
21.573 mln
jan 1, 1981
Maximum:
877.992 mln
jan 1, 2016
At the date of observation
Value
Absolute change
Change from previous value
jan 1, 1981
21.573 mln
+21.573 mln
0.0%
jan 1, 1982
36.67 mln
+15.097 mln
69.98%
jan 1, 1983
39.435 mln
+2.765 mln
7.54%
jan 1, 1984
50.458 mln
+11.022 mln
27.95%
jan 1, 1985
51.57 mln
+1.113 mln
2.21%
jan 1, 1986
48.525 mln
-3.045 mln
-5.91%
jan 1, 1987
61.583 mln
+13.058 mln
26.91%
jan 1, 1988
116.526 mln
+54.943 mln
89.22%
jan 1, 1989
115.592 mln
-933.98K
-0.8%
jan 1, 1990
126.913 mln
+11.321 mln
9.79%
jan 1, 1991
125.306 mln
-1.607 mln
-1.27%
jan 1, 1992
122.059 mln
-3.247 mln
-2.59%
jan 1, 1993
140.407 mln
+18.349 mln
15.03%
jan 1, 1994
142.264 mln
+1.856 mln
1.32%
jan 1, 1995
152.274 mln
+10.01 mln
7.04%
jan 1, 1996
176.578 mln
+24.304 mln
15.96%
jan 1, 1997
182.906 mln
+6.328 mln
3.58%
jan 1, 1998
181.365 mln
-1.541 mln
-0.84%
jan 1, 1999
189.874 mln
+8.509 mln
4.69%
jan 1, 2000
218.501 mln
+28.626 mln
15.08%
jan 1, 2001
234.356 mln
+15.856 mln
7.26%
jan 1, 2002
264.272 mln
+29.915 mln
12.76%
jan 1, 2003
308.568 mln
+44.297 mln
16.76%
jan 1, 2004
338.225 mln
+29.657 mln
9.61%
jan 1, 2005
345.106 mln
+6.88 mln
2.03%
jan 1, 2006
358.135 mln
+13.03 mln
3.78%
jan 1, 2007
389.78 mln
+31.644 mln
8.84%
jan 1, 2008
548.354 mln
+158.574 mln
40.68%
jan 1, 2009
582.832 mln
+34.478 mln
6.29%
jan 1, 2010
602.98 mln
+20.148 mln
3.46%
jan 1, 2011
678.239 mln
+75.259 mln
12.48%
jan 1, 2012
705.766 mln
+27.527 mln
4.06%
jan 1, 2013
753.531 mln
+47.765 mln
6.77%
jan 1, 2014
782.933 mln
+29.402 mln
3.9%
jan 1, 2015
811.998 mln
+29.065 mln
3.71%
jan 1, 2016
877.992 mln
+65.994 mln
8.13%
Ranking of countries by current statistics by years


Comments: