29
/
en
AIzaSyAYiBZKx7MnpbEhh9jyipgxe19OcubqV5w
April 1, 2024
50117
Middle East & North Africa (IDA & IBRD countries)
TMN
false
2
1
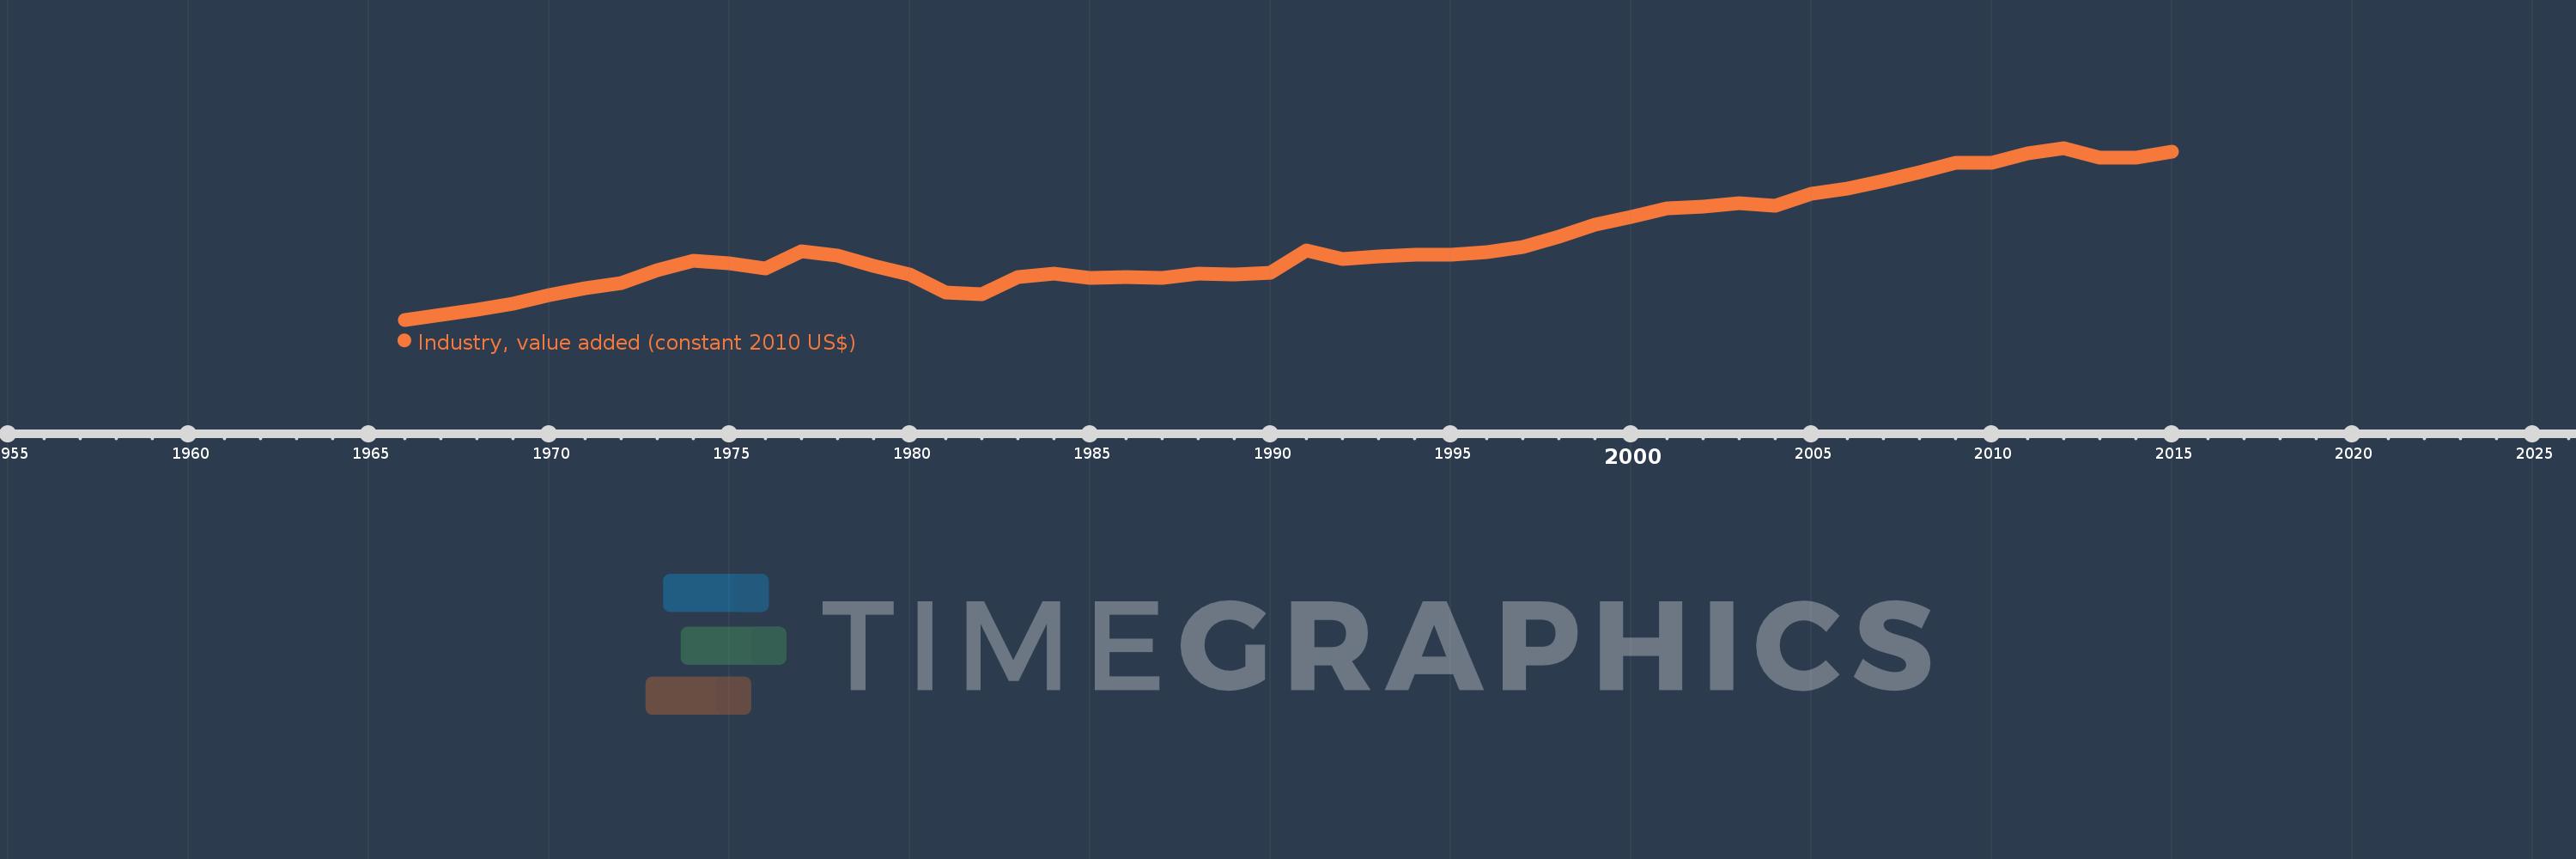
Industry, value added (constant 2010 US$)
2015,2014,2013,2012,2011,2010,2009,2008,2007,2006,2005,2004,2003,2002,2001,2000,1999,1998,1997,1996,1995,1994,1993,1992,1991,1990,1989,1988,1987,1986,1985,1984,1983,1982,1981,1980,1979,1978,1977,1976,1975,1974,1973,1972,1971,1970,1969,1968,1967,1966
This statistics in other country:
AfghanistanAlbaniaAlgeriaAndorraAntigua and BarbudaArab WorldArgentinaArmeniaArubaAustraliaAustriaAzerbaijanBahamas, TheBahrainBangladeshBarbadosBelarusBelgiumBelizeBeninBermudaBhutanBoliviaBosnia and HerzegovinaBotswanaBrazilBrunei DarussalamBulgariaBurkina FasoBurundiCabo VerdeCambodiaCameroonCanadaCaribbean small statesCentral African RepublicCentral Europe and the BalticsChadChileChinaColombiaComorosCongo, Dem. Rep.Congo, Rep.Costa RicaCote d'IvoireCroatiaCubaCyprusCzech RepublicDenmarkDominicaDominican RepublicEarly-demographic dividendEast Asia & PacificEast Asia & Pacific (excluding high income)East Asia & Pacific (IDA & IBRD countries)EcuadorEgypt, Arab Rep.El SalvadorEquatorial GuineaEstoniaEthiopiaEuro areaEurope & Central AsiaEurope & Central Asia (excluding high income)Europe & Central Asia (IDA & IBRD countries)European UnionFijiFinlandFragile and conflict affected situationsFranceGabonGambia, TheGeorgiaGermanyGhanaGreeceGrenadaGuatemalaGuineaGuinea-BissauGuyanaHeavily indebted poor countries (HIPC)High incomeHondurasHong Kong SAR, ChinaHungaryIBRD onlyIcelandIDA & IBRD totalIDA blendIDA onlyIDA totalIndiaIndonesiaIran, Islamic Rep.IraqIrelandItalyJamaicaJapanJordanKazakhstanKenyaKiribatiKorea, Rep.KosovoKuwaitKyrgyz RepublicLao PDRLate-demographic dividendLatin America & Caribbean Latin America & Caribbean (excluding high income)Latin America & the Caribbean (IDA & IBRD countries)LatviaLeast developed countries: UN classificationLebanonLesothoLiberiaLiechtensteinLithuaniaLow & middle incomeLow incomeLower middle incomeLuxembourgMacao SAR, ChinaMacedonia, FYRMadagascarMalawiMalaysiaMaldivesMaliMaltaMarshall IslandsMauritaniaMauritiusMexicoMicronesia, Fed. Sts.Middle East & North AfricaMiddle East & North Africa (excluding high income)Middle East & North Africa (IDA & IBRD countries)Middle incomeMoldovaMongoliaMontenegroMoroccoMozambiqueMyanmarNamibiaNepalNetherlandsNew ZealandNicaraguaNigerNigeriaNorth AmericaNorwayOECD membersOmanOther small statesPacific island small statesPakistanPalauPanamaParaguayPeruPhilippinesPolandPortugalPost-demographic dividendPre-demographic dividendPuerto RicoQatarRomaniaRussian FederationRwandaSamoaSao Tome and PrincipeSaudi ArabiaSenegalSerbiaSeychellesSierra LeoneSingaporeSlovak RepublicSloveniaSmall statesSouth AfricaSouth AsiaSouth Asia (IDA & IBRD)SpainSri LankaSt. Kitts and NevisSt. LuciaSt. Vincent and the GrenadinesSub-Saharan Africa Sub-Saharan Africa (excluding high income)Sub-Saharan Africa (IDA & IBRD countries)SudanSurinameSwazilandSwedenSwitzerlandTajikistanTanzaniaThailandTimor-LesteTogoTongaTrinidad and TobagoTunisiaTurkeyTurkmenistanTuvaluUgandaUkraineUnited Arab EmiratesUnited KingdomUnited StatesUpper middle incomeUruguayUzbekistanVanuatuVenezuela, RBVietnamWest Bank and GazaWorldYemen, Rep.ZambiaZimbabwe Timeline:
This timeline shows a graph from 1966 to 2015 of Middle East & North Africa (IDA & IBRD countries). No data until 1965. Number of actual observations by date: 50.
Source name:
World Development Indicators
Source organization:
World Bank national accounts data, and OECD National Accounts data files.
Categories, topics:
Economy & Growth
Last updated:
apr 23, 2017
Indicators value changes by year
Minimum:
102.819 bln
jan 1, 1966
Maximum:
541.194 bln
jan 1, 2012
At the date of observation
Value
Absolute change
Change from previous value
jan 1, 1966
102.819 bln
+102.819 bln
0.0%
jan 1, 1967
114.317 bln
+11.499 bln
11.18%
jan 1, 1968
127.499 bln
+13.182 bln
11.53%
jan 1, 1969
144.671 bln
+17.172 bln
13.47%
jan 1, 1970
166.115 bln
+21.444 bln
14.82%
jan 1, 1971
183.407 bln
+17.292 bln
10.41%
jan 1, 1972
196.227 bln
+12.82 bln
6.99%
jan 1, 1973
228.681 bln
+32.454 bln
16.54%
jan 1, 1974
253.019 bln
+24.339 bln
10.64%
jan 1, 1975
247.259 bln
-5.761 bln
-2.28%
jan 1, 1976
234.429 bln
-12.83 bln
-5.19%
jan 1, 1977
277.228 bln
+42.799 bln
18.26%
jan 1, 1978
266.813 bln
-10.414 bln
-3.76%
jan 1, 1979
240.394 bln
-26.419 bln
-9.9%
jan 1, 1980
218.979 bln
-21.415 bln
-8.91%
jan 1, 1981
172.078 bln
-46.901 bln
-21.42%
jan 1, 1982
168.099 bln
-3.979 bln
-2.31%
jan 1, 1983
211.385 bln
+43.286 bln
25.75%
jan 1, 1984
221.451 bln
+10.066 bln
4.76%
jan 1, 1985
209.67 bln
-11.781 bln
-5.32%
jan 1, 1986
212.816 bln
+3.146 bln
1.5%
jan 1, 1987
209.984 bln
-2.832 bln
-1.33%
jan 1, 1988
220.126 bln
+10.142 bln
4.83%
jan 1, 1989
218.642 bln
-1.484 bln
-0.67%
jan 1, 1990
222.789 bln
+4.147 bln
1.9%
jan 1, 1991
279.245 bln
+56.456 bln
25.34%
jan 1, 1992
257.655 bln
-21.59 bln
-7.73%
jan 1, 1993
265.193 bln
+7.538 bln
2.93%
jan 1, 1994
267.959 bln
+2.767 bln
1.04%
jan 1, 1995
267.736 bln
-223.718 mln
-0.08%
jan 1, 1996
275.013 bln
+7.278 bln
2.72%
jan 1, 1997
289.456 bln
+14.443 bln
5.25%
jan 1, 1998
314.709 bln
+25.253 bln
8.72%
jan 1, 1999
344.787 bln
+30.078 bln
9.56%
jan 1, 2000
365.757 bln
+20.97 bln
6.08%
jan 1, 2001
386.241 bln
+20.484 bln
5.6%
jan 1, 2002
390.708 bln
+4.466 bln
1.16%
jan 1, 2003
399.438 bln
+8.731 bln
2.23%
jan 1, 2004
393.661 bln
-5.777 bln
-1.45%
jan 1, 2005
423.927 bln
+30.265 bln
7.69%
jan 1, 2006
438.294 bln
+14.367 bln
3.39%
jan 1, 2007
456.618 bln
+18.324 bln
4.18%
jan 1, 2008
480.128 bln
+23.51 bln
5.15%
jan 1, 2009
502.297 bln
+22.169 bln
4.62%
jan 1, 2010
503.672 bln
+1.374 bln
0.27%
jan 1, 2011
528.433 bln
+24.761 bln
4.92%
jan 1, 2012
541.194 bln
+12.761 bln
2.41%
jan 1, 2013
516.904 bln
-24.29 bln
-4.49%
jan 1, 2014
516.272 bln
-632.424 mln
-0.12%
jan 1, 2015
531.853 bln
+15.581 bln
3.02%
Ranking of countries by current statistics by years


Comments: