29
/
en
AIzaSyAYiBZKx7MnpbEhh9jyipgxe19OcubqV5w
April 1, 2024
256476
Sweden
SWE
true
2
1
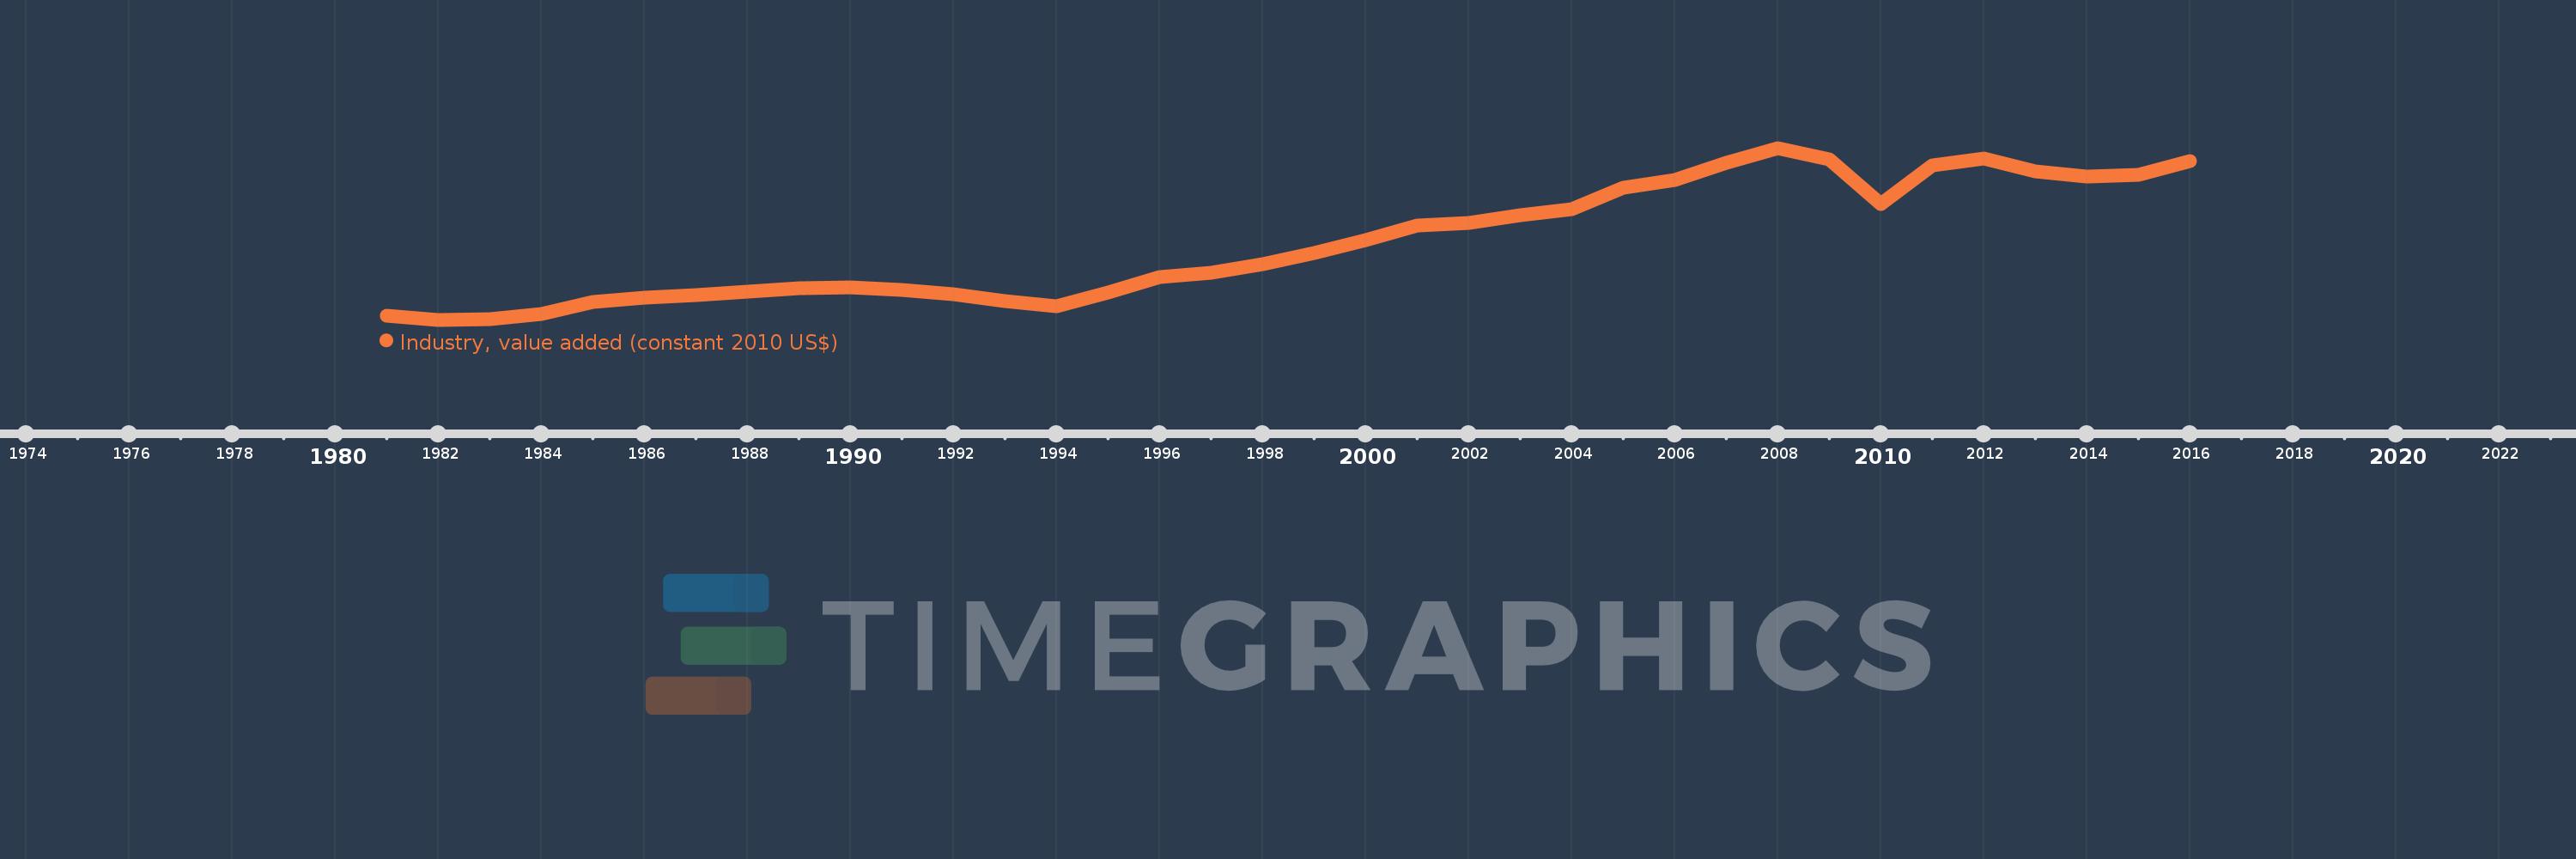
Industry, value added (constant 2010 US$)
2016,2015,2014,2013,2012,2011,2010,2009,2008,2007,2006,2005,2004,2003,2002,2001,2000,1999,1998,1997,1996,1995,1994,1993,1992,1991,1990,1989,1988,1987,1986,1985,1984,1983,1982,1981
This statistics in other country:
AfghanistanAlbaniaAlgeriaAndorraAntigua and BarbudaArab WorldArgentinaArmeniaArubaAustraliaAustriaAzerbaijanBahamas, TheBahrainBangladeshBarbadosBelarusBelgiumBelizeBeninBermudaBhutanBoliviaBosnia and HerzegovinaBotswanaBrazilBrunei DarussalamBulgariaBurkina FasoBurundiCabo VerdeCambodiaCameroonCanadaCaribbean small statesCentral African RepublicCentral Europe and the BalticsChadChileChinaColombiaComorosCongo, Dem. Rep.Congo, Rep.Costa RicaCote d'IvoireCroatiaCubaCyprusCzech RepublicDenmarkDominicaDominican RepublicEarly-demographic dividendEast Asia & PacificEast Asia & Pacific (excluding high income)East Asia & Pacific (IDA & IBRD countries)EcuadorEgypt, Arab Rep.El SalvadorEquatorial GuineaEstoniaEthiopiaEuro areaEurope & Central AsiaEurope & Central Asia (excluding high income)Europe & Central Asia (IDA & IBRD countries)European UnionFijiFinlandFragile and conflict affected situationsFranceGabonGambia, TheGeorgiaGermanyGhanaGreeceGrenadaGuatemalaGuineaGuinea-BissauGuyanaHeavily indebted poor countries (HIPC)High incomeHondurasHong Kong SAR, ChinaHungaryIBRD onlyIcelandIDA & IBRD totalIDA blendIDA onlyIDA totalIndiaIndonesiaIran, Islamic Rep.IraqIrelandItalyJamaicaJapanJordanKazakhstanKenyaKiribatiKorea, Rep.KosovoKuwaitKyrgyz RepublicLao PDRLate-demographic dividendLatin America & Caribbean Latin America & Caribbean (excluding high income)Latin America & the Caribbean (IDA & IBRD countries)LatviaLeast developed countries: UN classificationLebanonLesothoLiberiaLiechtensteinLithuaniaLow & middle incomeLow incomeLower middle incomeLuxembourgMacao SAR, ChinaMacedonia, FYRMadagascarMalawiMalaysiaMaldivesMaliMaltaMarshall IslandsMauritaniaMauritiusMexicoMicronesia, Fed. Sts.Middle East & North AfricaMiddle East & North Africa (excluding high income)Middle East & North Africa (IDA & IBRD countries)Middle incomeMoldovaMongoliaMontenegroMoroccoMozambiqueMyanmarNamibiaNepalNetherlandsNew ZealandNicaraguaNigerNigeriaNorth AmericaNorwayOECD membersOmanOther small statesPacific island small statesPakistanPalauPanamaParaguayPeruPhilippinesPolandPortugalPost-demographic dividendPre-demographic dividendPuerto RicoQatarRomaniaRussian FederationRwandaSamoaSao Tome and PrincipeSaudi ArabiaSenegalSerbiaSeychellesSierra LeoneSingaporeSlovak RepublicSloveniaSmall statesSouth AfricaSouth AsiaSouth Asia (IDA & IBRD)SpainSri LankaSt. Kitts and NevisSt. LuciaSt. Vincent and the GrenadinesSub-Saharan Africa Sub-Saharan Africa (excluding high income)Sub-Saharan Africa (IDA & IBRD countries)SudanSurinameSwazilandSwedenSwitzerlandTajikistanTanzaniaThailandTimor-LesteTogoTongaTrinidad and TobagoTunisiaTurkeyTurkmenistanTuvaluUgandaUkraineUnited Arab EmiratesUnited KingdomUnited StatesUpper middle incomeUruguayUzbekistanVanuatuVenezuela, RBVietnamWest Bank and GazaWorldYemen, Rep.ZambiaZimbabwe Timeline:
This timeline shows a graph from 1981 to 2016 of Sweden. No data until 1980. Number of actual observations by date: 36.
Source name:
World Development Indicators
Source organization:
World Bank national accounts data, and OECD National Accounts data files.
Categories, topics:
Economy & Growth
Last updated:
apr 23, 2017
Indicators value changes by year
Minimum:
56.659 bln
jan 1, 1982
Maximum:
132.003 bln
jan 1, 2008
At the date of observation
Value
Absolute change
Change from previous value
jan 1, 1981
58.572 bln
+58.572 bln
0.0%
jan 1, 1982
56.659 bln
-1.913 bln
-3.27%
jan 1, 1983
56.941 bln
+281.734 mln
0.5%
jan 1, 1984
59.029 bln
+2.089 bln
3.67%
jan 1, 1985
64.456 bln
+5.427 bln
9.19%
jan 1, 1986
66.31 bln
+1.853 bln
2.88%
jan 1, 1987
67.396 bln
+1.087 bln
1.64%
jan 1, 1988
68.975 bln
+1.579 bln
2.34%
jan 1, 1989
70.441 bln
+1.466 bln
2.13%
jan 1, 1990
70.91 bln
+468.741 mln
0.67%
jan 1, 1991
69.714 bln
-1.196 bln
-1.69%
jan 1, 1992
67.801 bln
-1.913 bln
-2.74%
jan 1, 1993
64.89 bln
-2.911 bln
-4.29%
jan 1, 1994
62.637 bln
-2.253 bln
-3.47%
jan 1, 1995
68.518 bln
+5.882 bln
9.39%
jan 1, 1996
75.382 bln
+6.863 bln
10.02%
jan 1, 1997
77.089 bln
+1.707 bln
2.26%
jan 1, 1998
81.028 bln
+3.939 bln
5.11%
jan 1, 1999
85.858 bln
+4.829 bln
5.96%
jan 1, 2000
91.415 bln
+5.557 bln
6.47%
jan 1, 2001
98.164 bln
+6.749 bln
7.38%
jan 1, 2002
99.095 bln
+931.252 mln
0.95%
jan 1, 2003
102.546 bln
+3.451 bln
3.48%
jan 1, 2004
105.316 bln
+2.77 bln
2.7%
jan 1, 2005
114.373 bln
+9.057 bln
8.6%
jan 1, 2006
117.9 bln
+3.527 bln
3.08%
jan 1, 2007
125.417 bln
+7.517 bln
6.38%
jan 1, 2008
132.003 bln
+6.586 bln
5.25%
jan 1, 2009
126.866 bln
-5.137 bln
-3.89%
jan 1, 2010
107.368 bln
-19.499 bln
-15.37%
jan 1, 2011
124.224 bln
+16.857 bln
15.7%
jan 1, 2012
127.277 bln
+3.053 bln
2.46%
jan 1, 2013
121.602 bln
-5.676 bln
-4.46%
jan 1, 2014
119.382 bln
-2.22 bln
-1.83%
jan 1, 2015
120.085 bln
+702.74 mln
0.59%
jan 1, 2016
126.35 bln
+6.265 bln
5.22%
Ranking of countries by current statistics by years


Comments: