29
/
en
AIzaSyAYiBZKx7MnpbEhh9jyipgxe19OcubqV5w
April 1, 2024
109819
Congo, Dem. Rep.
COD
true
2
1
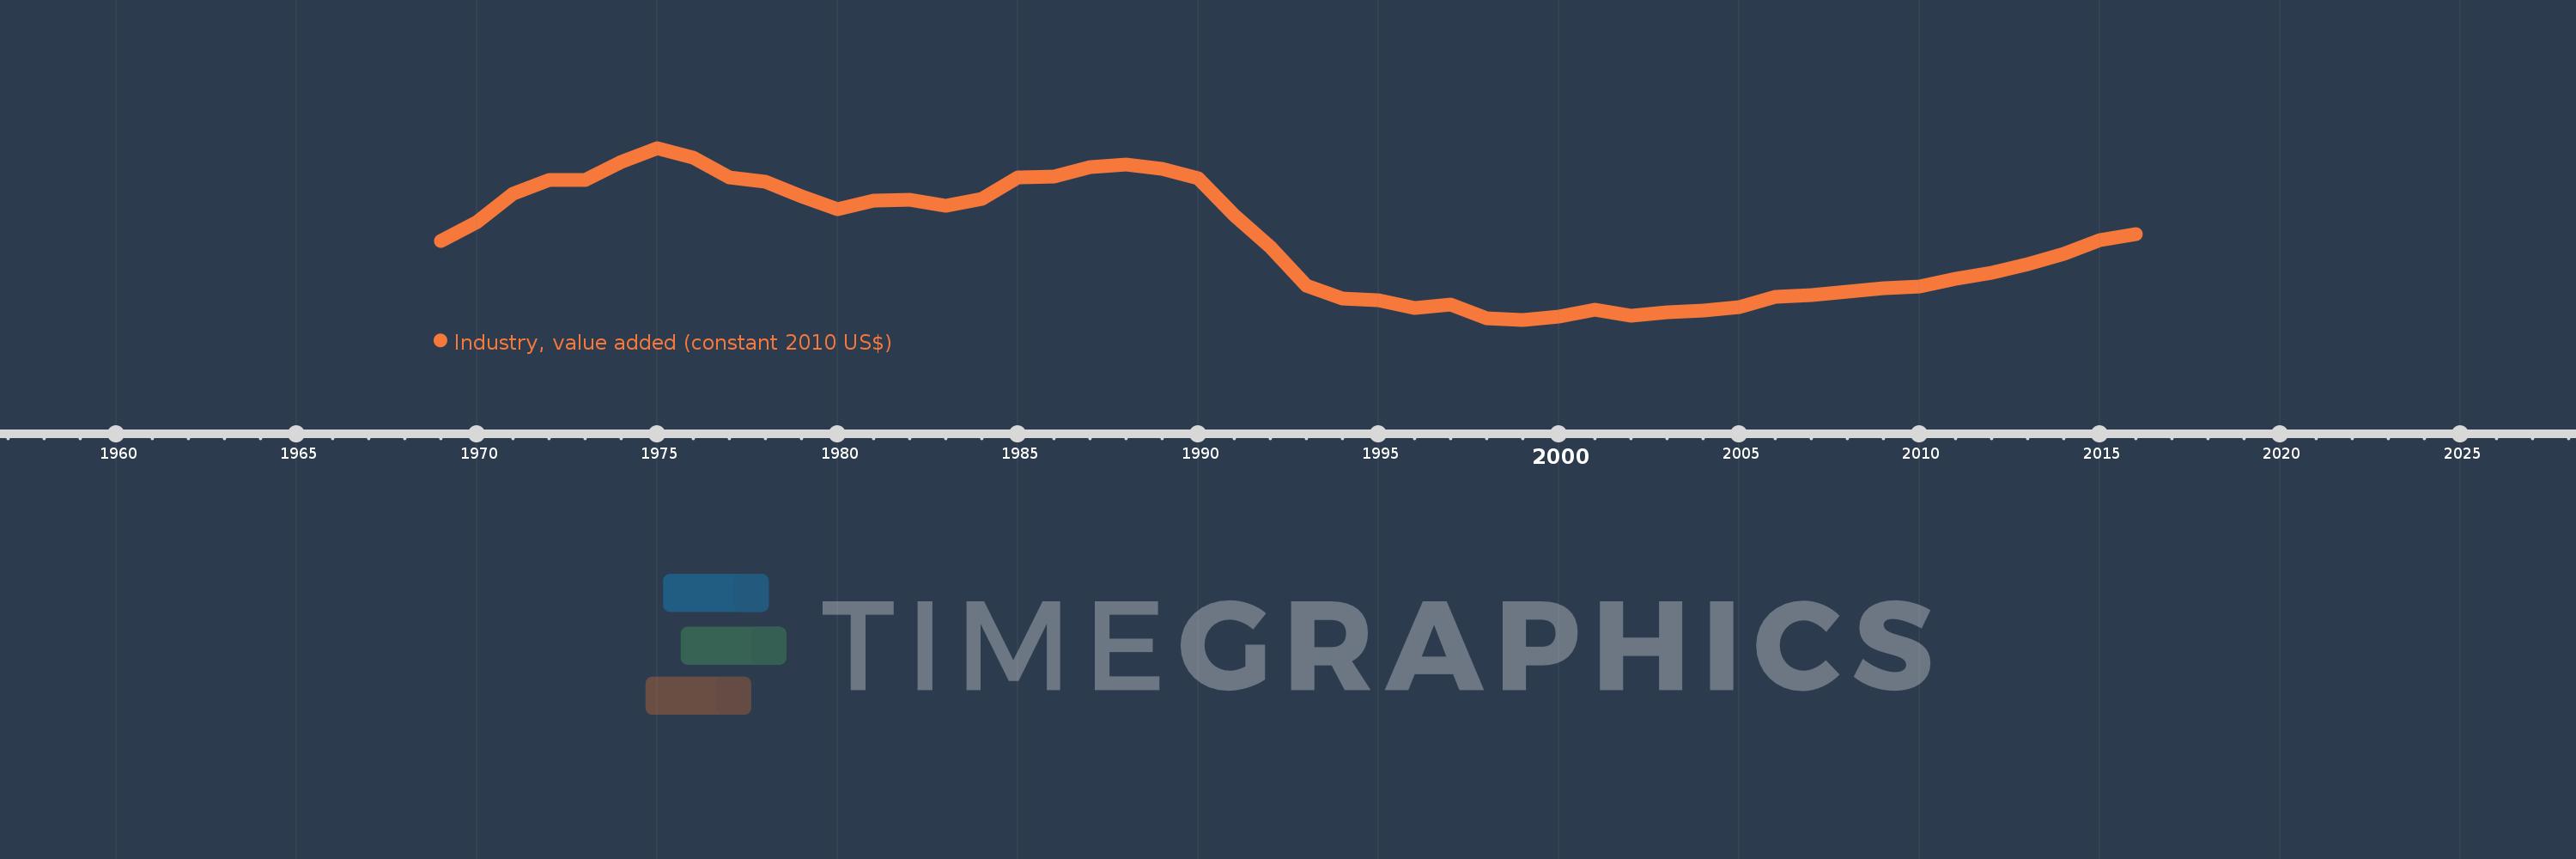
Industry, value added (constant 2010 US$)
2016,2015,2014,2013,2012,2011,2010,2009,2008,2007,2006,2005,2004,2003,2002,2001,2000,1999,1998,1997,1996,1995,1994,1993,1992,1991,1990,1989,1988,1987,1986,1985,1984,1983,1982,1981,1980,1979,1978,1977,1976,1975,1974,1973,1972,1971,1970,1969
This statistics in other country:
AfghanistanAlbaniaAlgeriaAndorraAntigua and BarbudaArab WorldArgentinaArmeniaArubaAustraliaAustriaAzerbaijanBahamas, TheBahrainBangladeshBarbadosBelarusBelgiumBelizeBeninBermudaBhutanBoliviaBosnia and HerzegovinaBotswanaBrazilBrunei DarussalamBulgariaBurkina FasoBurundiCabo VerdeCambodiaCameroonCanadaCaribbean small statesCentral African RepublicCentral Europe and the BalticsChadChileChinaColombiaComorosCongo, Dem. Rep.Congo, Rep.Costa RicaCote d'IvoireCroatiaCubaCyprusCzech RepublicDenmarkDominicaDominican RepublicEarly-demographic dividendEast Asia & PacificEast Asia & Pacific (excluding high income)East Asia & Pacific (IDA & IBRD countries)EcuadorEgypt, Arab Rep.El SalvadorEquatorial GuineaEstoniaEthiopiaEuro areaEurope & Central AsiaEurope & Central Asia (excluding high income)Europe & Central Asia (IDA & IBRD countries)European UnionFijiFinlandFragile and conflict affected situationsFranceGabonGambia, TheGeorgiaGermanyGhanaGreeceGrenadaGuatemalaGuineaGuinea-BissauGuyanaHeavily indebted poor countries (HIPC)High incomeHondurasHong Kong SAR, ChinaHungaryIBRD onlyIcelandIDA & IBRD totalIDA blendIDA onlyIDA totalIndiaIndonesiaIran, Islamic Rep.IraqIrelandItalyJamaicaJapanJordanKazakhstanKenyaKiribatiKorea, Rep.KosovoKuwaitKyrgyz RepublicLao PDRLate-demographic dividendLatin America & Caribbean Latin America & Caribbean (excluding high income)Latin America & the Caribbean (IDA & IBRD countries)LatviaLeast developed countries: UN classificationLebanonLesothoLiberiaLiechtensteinLithuaniaLow & middle incomeLow incomeLower middle incomeLuxembourgMacao SAR, ChinaMacedonia, FYRMadagascarMalawiMalaysiaMaldivesMaliMaltaMarshall IslandsMauritaniaMauritiusMexicoMicronesia, Fed. Sts.Middle East & North AfricaMiddle East & North Africa (excluding high income)Middle East & North Africa (IDA & IBRD countries)Middle incomeMoldovaMongoliaMontenegroMoroccoMozambiqueMyanmarNamibiaNepalNetherlandsNew ZealandNicaraguaNigerNigeriaNorth AmericaNorwayOECD membersOmanOther small statesPacific island small statesPakistanPalauPanamaParaguayPeruPhilippinesPolandPortugalPost-demographic dividendPre-demographic dividendPuerto RicoQatarRomaniaRussian FederationRwandaSamoaSao Tome and PrincipeSaudi ArabiaSenegalSerbiaSeychellesSierra LeoneSingaporeSlovak RepublicSloveniaSmall statesSouth AfricaSouth AsiaSouth Asia (IDA & IBRD)SpainSri LankaSt. Kitts and NevisSt. LuciaSt. Vincent and the GrenadinesSub-Saharan Africa Sub-Saharan Africa (excluding high income)Sub-Saharan Africa (IDA & IBRD countries)SudanSurinameSwazilandSwedenSwitzerlandTajikistanTanzaniaThailandTimor-LesteTogoTongaTrinidad and TobagoTunisiaTurkeyTurkmenistanTuvaluUgandaUkraineUnited Arab EmiratesUnited KingdomUnited StatesUpper middle incomeUruguayUzbekistanVanuatuVenezuela, RBVietnamWest Bank and GazaWorldYemen, Rep.ZambiaZimbabwe Timeline:
This timeline shows a graph from 1969 to 2016 of Congo, Dem. Rep.. No data until 1968. Number of actual observations by date: 48.
Source name:
World Development Indicators
Source organization:
World Bank national accounts data, and OECD National Accounts data files.
Categories, topics:
Economy & Growth
Last updated:
apr 23, 2017
Indicators value changes by year
Minimum:
3.914 bln
jan 1, 1999
Maximum:
15.869 bln
jan 1, 1975
At the date of observation
Value
Absolute change
Change from previous value
jan 1, 1969
9.384 bln
+9.384 bln
0.0%
jan 1, 1970
10.683 bln
+1.298 bln
13.83%
jan 1, 1971
12.71 bln
+2.028 bln
18.98%
jan 1, 1972
13.613 bln
+902.338 mln
7.1%
jan 1, 1973
13.651 bln
+38.662 mln
0.28%
jan 1, 1974
14.896 bln
+1.245 bln
9.12%
jan 1, 1975
15.869 bln
+972.795 mln
6.53%
jan 1, 1976
15.169 bln
-699.873 mln
-4.41%
jan 1, 1977
13.823 bln
-1.346 bln
-8.88%
jan 1, 1978
13.545 bln
-277.438 mln
-2.01%
jan 1, 1979
12.481 bln
-1.064 bln
-7.85%
jan 1, 1980
11.626 bln
-855.078 mln
-6.85%
jan 1, 1981
12.19 bln
+563.908 mln
4.85%
jan 1, 1982
12.25 bln
+60.003 mln
0.49%
jan 1, 1983
11.837 bln
-413.59 mln
-3.38%
jan 1, 1984
12.305 bln
+468.087 mln
3.95%
jan 1, 1985
13.842 bln
+1.538 bln
12.5%
jan 1, 1986
13.885 bln
+43.239 mln
0.31%
jan 1, 1987
14.556 bln
+670.985 mln
4.83%
jan 1, 1988
14.692 bln
+135.532 mln
0.93%
jan 1, 1989
14.409 bln
-283.066 mln
-1.93%
jan 1, 1990
13.777 bln
-632.088 mln
-4.39%
jan 1, 1991
11.172 bln
-2.605 bln
-18.91%
jan 1, 1992
8.951 bln
-2.221 bln
-19.88%
jan 1, 1993
6.273 bln
-2.678 bln
-29.92%
jan 1, 1994
5.363 bln
-909.328 mln
-14.5%
jan 1, 1995
5.252 bln
-111.346 mln
-2.08%
jan 1, 1996
4.707 bln
-544.36 mln
-10.37%
jan 1, 1997
4.984 bln
+276.646 mln
5.88%
jan 1, 1998
3.995 bln
-988.815 mln
-19.84%
jan 1, 1999
3.914 bln
-81.374 mln
-2.04%
jan 1, 2000
4.146 bln
+231.574 mln
5.92%
jan 1, 2001
4.585 bln
+439.918 mln
10.61%
jan 1, 2002
4.215 bln
-369.984 mln
-8.07%
jan 1, 2003
4.429 bln
+214.025 mln
5.08%
jan 1, 2004
4.537 bln
+107.317 mln
2.42%
jan 1, 2005
4.798 bln
+260.843 mln
5.75%
jan 1, 2006
5.48 bln
+682.509 mln
14.23%
jan 1, 2007
5.622 bln
+142.348 mln
2.6%
jan 1, 2008
5.875 bln
+252.046 mln
4.48%
jan 1, 2009
6.135 bln
+260.9 mln
4.44%
jan 1, 2010
6.232 bln
+96.413 mln
1.57%
jan 1, 2011
6.737 bln
+505.332 mln
8.11%
jan 1, 2012
7.205 bln
+468.055 mln
6.95%
jan 1, 2013
7.782 bln
+576.853 mln
8.01%
jan 1, 2014
8.482 bln
+700.387 mln
9.0%
jan 1, 2015
9.45 bln
+967.171 mln
11.4%
jan 1, 2016
9.903 bln
+453.678 mln
4.8%
Ranking of countries by current statistics by years


Comments: