29
/
en
AIzaSyAYiBZKx7MnpbEhh9jyipgxe19OcubqV5w
April 1, 2024
148079
Guyana
GUY
true
2
1
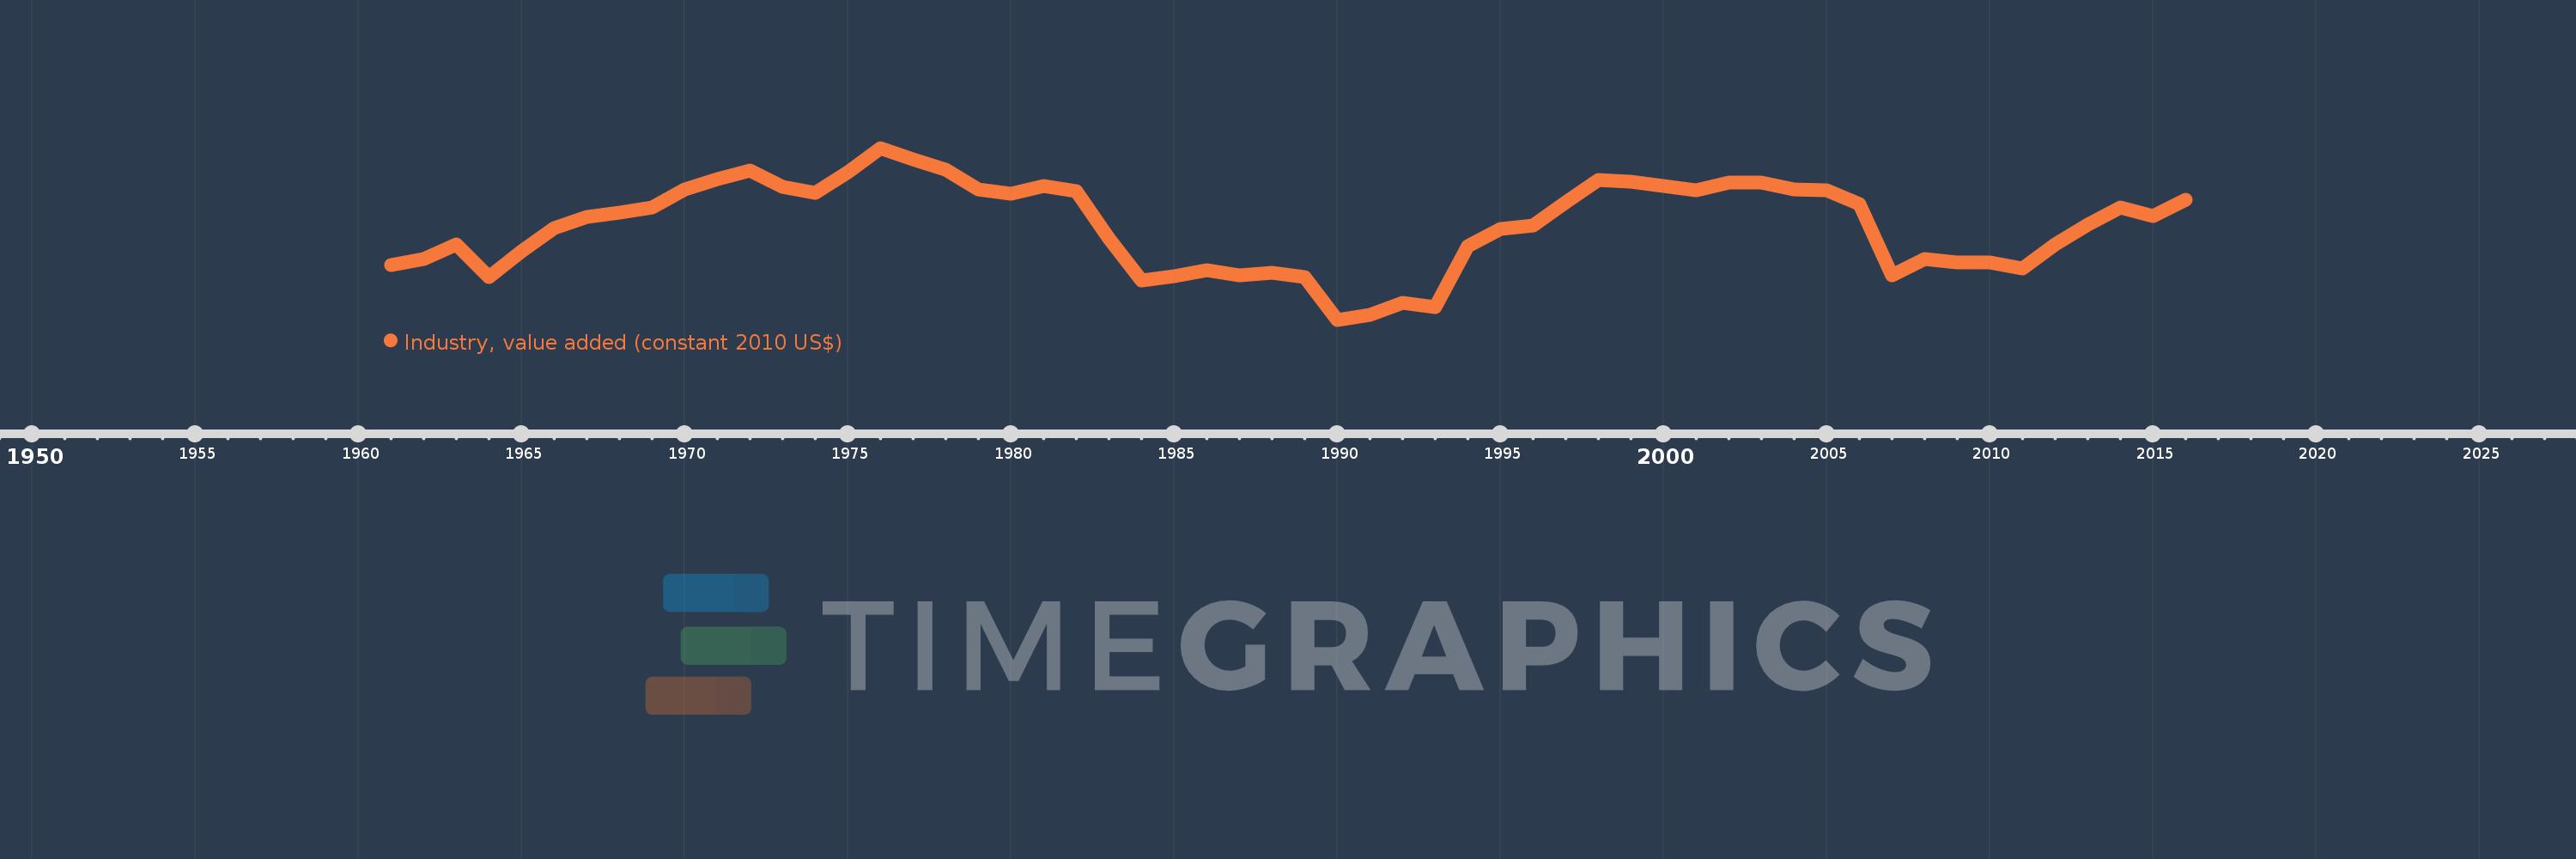
Industry, value added (constant 2010 US$)
2016,2015,2014,2013,2012,2011,2010,2009,2008,2007,2006,2005,2004,2003,2002,2001,2000,1999,1998,1997,1996,1995,1994,1993,1992,1991,1990,1989,1988,1987,1986,1985,1984,1983,1982,1981,1980,1979,1978,1977,1976,1975,1974,1973,1972,1971,1970,1969,1968,1967,1966,1965,1964,1963,1962,1961
This statistics in other country:
AfghanistanAlbaniaAlgeriaAndorraAntigua and BarbudaArab WorldArgentinaArmeniaArubaAustraliaAustriaAzerbaijanBahamas, TheBahrainBangladeshBarbadosBelarusBelgiumBelizeBeninBermudaBhutanBoliviaBosnia and HerzegovinaBotswanaBrazilBrunei DarussalamBulgariaBurkina FasoBurundiCabo VerdeCambodiaCameroonCanadaCaribbean small statesCentral African RepublicCentral Europe and the BalticsChadChileChinaColombiaComorosCongo, Dem. Rep.Congo, Rep.Costa RicaCote d'IvoireCroatiaCubaCyprusCzech RepublicDenmarkDominicaDominican RepublicEarly-demographic dividendEast Asia & PacificEast Asia & Pacific (excluding high income)East Asia & Pacific (IDA & IBRD countries)EcuadorEgypt, Arab Rep.El SalvadorEquatorial GuineaEstoniaEthiopiaEuro areaEurope & Central AsiaEurope & Central Asia (excluding high income)Europe & Central Asia (IDA & IBRD countries)European UnionFijiFinlandFragile and conflict affected situationsFranceGabonGambia, TheGeorgiaGermanyGhanaGreeceGrenadaGuatemalaGuineaGuinea-BissauGuyanaHeavily indebted poor countries (HIPC)High incomeHondurasHong Kong SAR, ChinaHungaryIBRD onlyIcelandIDA & IBRD totalIDA blendIDA onlyIDA totalIndiaIndonesiaIran, Islamic Rep.IraqIrelandItalyJamaicaJapanJordanKazakhstanKenyaKiribatiKorea, Rep.KosovoKuwaitKyrgyz RepublicLao PDRLate-demographic dividendLatin America & Caribbean Latin America & Caribbean (excluding high income)Latin America & the Caribbean (IDA & IBRD countries)LatviaLeast developed countries: UN classificationLebanonLesothoLiberiaLiechtensteinLithuaniaLow & middle incomeLow incomeLower middle incomeLuxembourgMacao SAR, ChinaMacedonia, FYRMadagascarMalawiMalaysiaMaldivesMaliMaltaMarshall IslandsMauritaniaMauritiusMexicoMicronesia, Fed. Sts.Middle East & North AfricaMiddle East & North Africa (excluding high income)Middle East & North Africa (IDA & IBRD countries)Middle incomeMoldovaMongoliaMontenegroMoroccoMozambiqueMyanmarNamibiaNepalNetherlandsNew ZealandNicaraguaNigerNigeriaNorth AmericaNorwayOECD membersOmanOther small statesPacific island small statesPakistanPalauPanamaParaguayPeruPhilippinesPolandPortugalPost-demographic dividendPre-demographic dividendPuerto RicoQatarRomaniaRussian FederationRwandaSamoaSao Tome and PrincipeSaudi ArabiaSenegalSerbiaSeychellesSierra LeoneSingaporeSlovak RepublicSloveniaSmall statesSouth AfricaSouth AsiaSouth Asia (IDA & IBRD)SpainSri LankaSt. Kitts and NevisSt. LuciaSt. Vincent and the GrenadinesSub-Saharan Africa Sub-Saharan Africa (excluding high income)Sub-Saharan Africa (IDA & IBRD countries)SudanSurinameSwazilandSwedenSwitzerlandTajikistanTanzaniaThailandTimor-LesteTogoTongaTrinidad and TobagoTunisiaTurkeyTurkmenistanTuvaluUgandaUkraineUnited Arab EmiratesUnited KingdomUnited StatesUpper middle incomeUruguayUzbekistanVanuatuVenezuela, RBVietnamWest Bank and GazaWorldYemen, Rep.ZambiaZimbabwe Timeline:
This timeline shows a graph from 1961 to 2016 of Guyana. No data until 1960. Number of actual observations by date: 56.
Source name:
World Development Indicators
Source organization:
World Bank national accounts data, and OECD National Accounts data files.
Categories, topics:
Economy & Growth
Last updated:
apr 23, 2017
Indicators value changes by year
Minimum:
312.97 mln
jan 1, 1990
Maximum:
765.898 mln
jan 1, 1976
At the date of observation
Value
Absolute change
Change from previous value
jan 1, 1961
457.2 mln
+457.2 mln
0.0%
jan 1, 1962
473.168 mln
+15.968 mln
3.49%
jan 1, 1963
511.57 mln
+38.403 mln
8.12%
jan 1, 1964
424.466 mln
-87.105 mln
-17.03%
jan 1, 1965
493.247 mln
+68.782 mln
16.2%
jan 1, 1966
555.602 mln
+62.354 mln
12.64%
jan 1, 1967
584.224 mln
+28.622 mln
5.15%
jan 1, 1968
595.761 mln
+11.537 mln
1.97%
jan 1, 1969
608.415 mln
+12.655 mln
2.12%
jan 1, 1970
656.399 mln
+47.983 mln
7.89%
jan 1, 1971
683.983 mln
+27.584 mln
4.2%
jan 1, 1972
705.46 mln
+21.477 mln
3.14%
jan 1, 1973
662.586 mln
-42.874 mln
-6.08%
jan 1, 1974
647.018 mln
-15.569 mln
-2.35%
jan 1, 1975
701.548 mln
+54.53 mln
8.43%
jan 1, 1976
765.898 mln
+64.35 mln
9.17%
jan 1, 1977
734.721 mln
-31.177 mln
-4.07%
jan 1, 1978
709.372 mln
-25.349 mln
-3.45%
jan 1, 1979
656.758 mln
-52.614 mln
-7.42%
jan 1, 1980
645.062 mln
-11.696 mln
-1.78%
jan 1, 1981
666.578 mln
+21.517 mln
3.34%
jan 1, 1982
652.846 mln
-13.732 mln
-2.06%
jan 1, 1983
528.137 mln
-124.709 mln
-19.1%
jan 1, 1984
417.041 mln
-111.096 mln
-21.04%
jan 1, 1985
426.821 mln
+9.78 mln
2.35%
jan 1, 1986
444.346 mln
+17.525 mln
4.11%
jan 1, 1987
430.693 mln
-13.653 mln
-3.07%
jan 1, 1988
436.322 mln
+5.629 mln
1.31%
jan 1, 1989
425.544 mln
-10.778 mln
-2.47%
jan 1, 1990
312.97 mln
-112.573 mln
-26.45%
jan 1, 1991
325.345 mln
+12.375 mln
3.95%
jan 1, 1992
356.882 mln
+31.537 mln
9.69%
jan 1, 1993
346.503 mln
-10.379 mln
-2.91%
jan 1, 1994
507.379 mln
+160.876 mln
46.43%
jan 1, 1995
553.286 mln
+45.908 mln
9.05%
jan 1, 1996
561.27 mln
+7.984 mln
1.44%
jan 1, 1997
622.747 mln
+61.476 mln
10.95%
jan 1, 1998
682.227 mln
+59.48 mln
9.55%
jan 1, 1999
675.84 mln
-6.387 mln
-0.94%
jan 1, 2000
665.461 mln
-10.379 mln
-1.54%
jan 1, 2001
655.082 mln
-10.379 mln
-1.56%
jan 1, 2002
674.642 mln
+19.561 mln
2.99%
jan 1, 2003
674.459 mln
-183.643K
-0.03%
jan 1, 2004
655.846 mln
-18.612 mln
-2.76%
jan 1, 2005
654.523 mln
-1.324 mln
-0.2%
jan 1, 2006
618.755 mln
-35.768 mln
-5.46%
jan 1, 2007
430.058 mln
-188.697 mln
-30.5%
jan 1, 2008
472.364 mln
+42.306 mln
9.84%
jan 1, 2009
463.885 mln
-8.479 mln
-1.8%
jan 1, 2010
463.154 mln
-731.103K
-0.16%
jan 1, 2011
448.487 mln
-14.667 mln
-3.17%
jan 1, 2012
511.656 mln
+63.169 mln
14.08%
jan 1, 2013
562.842 mln
+51.186 mln
10.0%
jan 1, 2014
607.885 mln
+45.043 mln
8.0%
jan 1, 2015
586.478 mln
-21.407 mln
-3.52%
jan 1, 2016
630.202 mln
+43.724 mln
7.46%
Ranking of countries by current statistics by years


Comments: