29
/
en
AIzaSyAYiBZKx7MnpbEhh9jyipgxe19OcubqV5w
April 1, 2024
122278
Dominican Republic
DOM
true
2
1
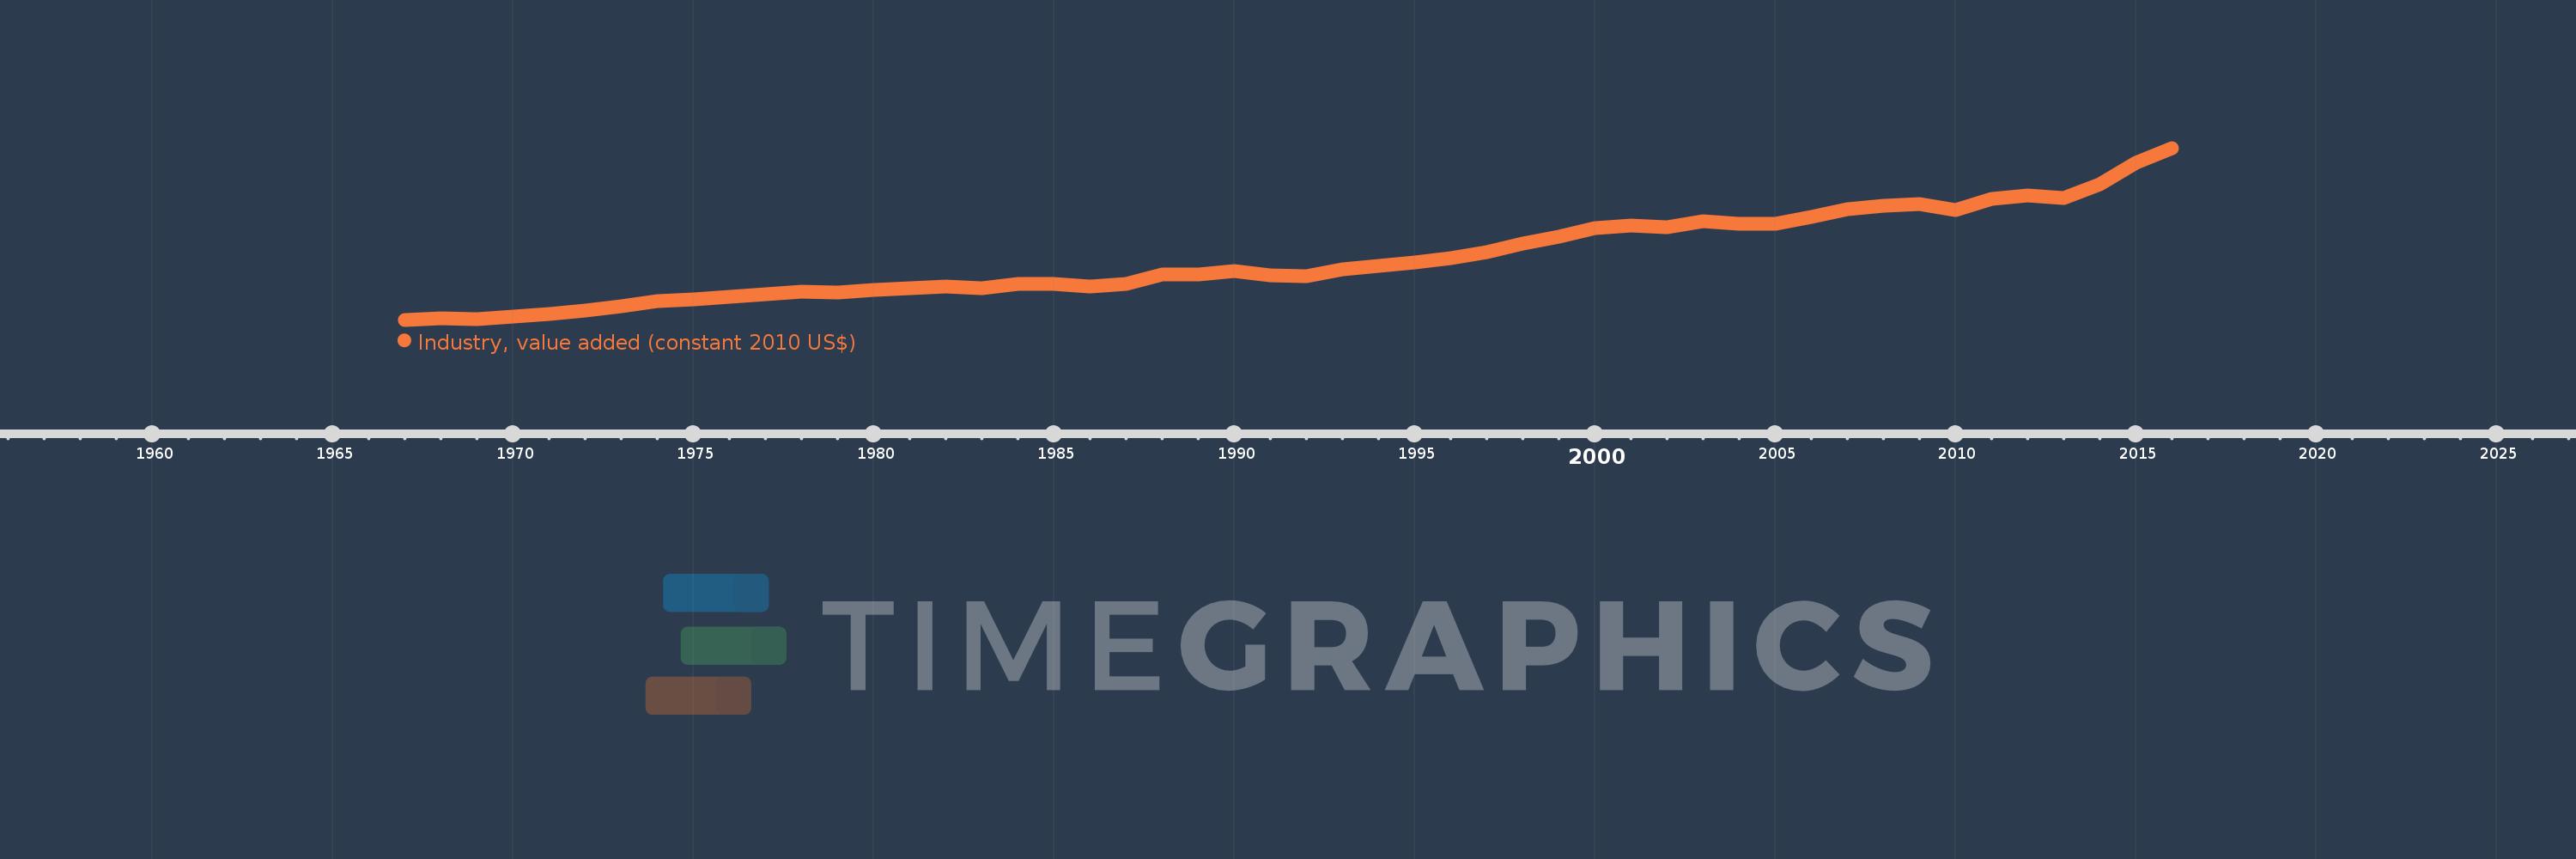
Industry, value added (constant 2010 US$)
2016,2015,2014,2013,2012,2011,2010,2009,2008,2007,2006,2005,2004,2003,2002,2001,2000,1999,1998,1997,1996,1995,1994,1993,1992,1991,1990,1989,1988,1987,1986,1985,1984,1983,1982,1981,1980,1979,1978,1977,1976,1975,1974,1973,1972,1971,1970,1969,1968,1967
This statistics in other country:
AfghanistanAlbaniaAlgeriaAndorraAntigua and BarbudaArab WorldArgentinaArmeniaArubaAustraliaAustriaAzerbaijanBahamas, TheBahrainBangladeshBarbadosBelarusBelgiumBelizeBeninBermudaBhutanBoliviaBosnia and HerzegovinaBotswanaBrazilBrunei DarussalamBulgariaBurkina FasoBurundiCabo VerdeCambodiaCameroonCanadaCaribbean small statesCentral African RepublicCentral Europe and the BalticsChadChileChinaColombiaComorosCongo, Dem. Rep.Congo, Rep.Costa RicaCote d'IvoireCroatiaCubaCyprusCzech RepublicDenmarkDominicaDominican RepublicEarly-demographic dividendEast Asia & PacificEast Asia & Pacific (excluding high income)East Asia & Pacific (IDA & IBRD countries)EcuadorEgypt, Arab Rep.El SalvadorEquatorial GuineaEstoniaEthiopiaEuro areaEurope & Central AsiaEurope & Central Asia (excluding high income)Europe & Central Asia (IDA & IBRD countries)European UnionFijiFinlandFragile and conflict affected situationsFranceGabonGambia, TheGeorgiaGermanyGhanaGreeceGrenadaGuatemalaGuineaGuinea-BissauGuyanaHeavily indebted poor countries (HIPC)High incomeHondurasHong Kong SAR, ChinaHungaryIBRD onlyIcelandIDA & IBRD totalIDA blendIDA onlyIDA totalIndiaIndonesiaIran, Islamic Rep.IraqIrelandItalyJamaicaJapanJordanKazakhstanKenyaKiribatiKorea, Rep.KosovoKuwaitKyrgyz RepublicLao PDRLate-demographic dividendLatin America & Caribbean Latin America & Caribbean (excluding high income)Latin America & the Caribbean (IDA & IBRD countries)LatviaLeast developed countries: UN classificationLebanonLesothoLiberiaLiechtensteinLithuaniaLow & middle incomeLow incomeLower middle incomeLuxembourgMacao SAR, ChinaMacedonia, FYRMadagascarMalawiMalaysiaMaldivesMaliMaltaMarshall IslandsMauritaniaMauritiusMexicoMicronesia, Fed. Sts.Middle East & North AfricaMiddle East & North Africa (excluding high income)Middle East & North Africa (IDA & IBRD countries)Middle incomeMoldovaMongoliaMontenegroMoroccoMozambiqueMyanmarNamibiaNepalNetherlandsNew ZealandNicaraguaNigerNigeriaNorth AmericaNorwayOECD membersOmanOther small statesPacific island small statesPakistanPalauPanamaParaguayPeruPhilippinesPolandPortugalPost-demographic dividendPre-demographic dividendPuerto RicoQatarRomaniaRussian FederationRwandaSamoaSao Tome and PrincipeSaudi ArabiaSenegalSerbiaSeychellesSierra LeoneSingaporeSlovak RepublicSloveniaSmall statesSouth AfricaSouth AsiaSouth Asia (IDA & IBRD)SpainSri LankaSt. Kitts and NevisSt. LuciaSt. Vincent and the GrenadinesSub-Saharan Africa Sub-Saharan Africa (excluding high income)Sub-Saharan Africa (IDA & IBRD countries)SudanSurinameSwazilandSwedenSwitzerlandTajikistanTanzaniaThailandTimor-LesteTogoTongaTrinidad and TobagoTunisiaTurkeyTurkmenistanTuvaluUgandaUkraineUnited Arab EmiratesUnited KingdomUnited StatesUpper middle incomeUruguayUzbekistanVanuatuVenezuela, RBVietnamWest Bank and GazaWorldYemen, Rep.ZambiaZimbabwe Timeline:
This timeline shows a graph from 1967 to 2016 of Dominican Republic. No data until 1966. Number of actual observations by date: 50.
Source name:
World Development Indicators
Source organization:
World Bank national accounts data, and OECD National Accounts data files.
Categories, topics:
Economy & Growth
Last updated:
apr 23, 2017
Indicators value changes by year
Minimum:
1.376 bln
jan 1, 1967
Maximum:
19.168 bln
jan 1, 2016
At the date of observation
Value
Absolute change
Change from previous value
jan 1, 1967
1.376 bln
+1.376 bln
0.0%
jan 1, 1968
1.514 bln
+138.213 mln
10.05%
jan 1, 1969
1.451 bln
-63.592 mln
-4.2%
jan 1, 1970
1.672 bln
+221.009 mln
15.24%
jan 1, 1971
1.984 bln
+312.745 mln
18.71%
jan 1, 1972
2.338 bln
+354.149 mln
17.85%
jan 1, 1973
2.733 bln
+395.016 mln
16.89%
jan 1, 1974
3.297 bln
+563.643 mln
20.62%
jan 1, 1975
3.467 bln
+169.68 mln
5.15%
jan 1, 1976
3.745 bln
+277.997 mln
8.02%
jan 1, 1977
4.028 bln
+283.107 mln
7.56%
jan 1, 1978
4.264 bln
+236.093 mln
5.86%
jan 1, 1979
4.161 bln
-102.716 mln
-2.41%
jan 1, 1980
4.49 bln
+329.099 mln
7.91%
jan 1, 1981
4.684 bln
+193.678 mln
4.31%
jan 1, 1982
4.84 bln
+155.862 mln
3.33%
jan 1, 1983
4.626 bln
-214.119 mln
-4.42%
jan 1, 1984
5.049 bln
+423.127 mln
9.15%
jan 1, 1985
5.095 bln
+46.503 mln
0.92%
jan 1, 1986
4.777 bln
-318.879 mln
-6.26%
jan 1, 1987
5.126 bln
+349.029 mln
7.31%
jan 1, 1988
6.094 bln
+968.9 mln
18.9%
jan 1, 1989
6.056 bln
-38.327 mln
-0.63%
jan 1, 1990
6.388 bln
+331.654 mln
5.48%
jan 1, 1991
5.998 bln
-389.306 mln
-6.09%
jan 1, 1992
5.858 bln
-140.625 mln
-2.34%
jan 1, 1993
6.558 bln
+700.386 mln
11.96%
jan 1, 1994
6.983 bln
+424.602 mln
6.47%
jan 1, 1995
7.341 bln
+358.315 mln
5.13%
jan 1, 1996
7.727 bln
+386.308 mln
5.26%
jan 1, 1997
8.398 bln
+670.706 mln
8.68%
jan 1, 1998
9.291 bln
+892.781 mln
10.63%
jan 1, 1999
9.945 bln
+653.843 mln
7.04%
jan 1, 2000
10.871 bln
+926.381 mln
9.32%
jan 1, 2001
11.171 bln
+300.137 mln
2.76%
jan 1, 2002
10.985 bln
-185.903 mln
-1.66%
jan 1, 2003
11.558 bln
+572.619 mln
5.21%
jan 1, 2004
11.295 bln
-263.136 mln
-2.28%
jan 1, 2005
11.331 bln
+36.101 mln
0.32%
jan 1, 2006
12.066 bln
+734.899 mln
6.49%
jan 1, 2007
12.847 bln
+781.09 mln
6.47%
jan 1, 2008
13.202 bln
+354.788 mln
2.76%
jan 1, 2009
13.401 bln
+199.692 mln
1.51%
jan 1, 2010
12.694 bln
-707.551 mln
-5.28%
jan 1, 2011
13.923 bln
+1.229 bln
9.68%
jan 1, 2012
14.254 bln
+331.429 mln
2.38%
jan 1, 2013
14.018 bln
-236.212 mln
-1.66%
jan 1, 2014
15.386 bln
+1.368 bln
9.76%
jan 1, 2015
17.663 bln
+2.278 bln
14.8%
jan 1, 2016
19.168 bln
+1.504 bln
8.52%
Ranking of countries by current statistics by years


Comments: