29
/
en
AIzaSyAYiBZKx7MnpbEhh9jyipgxe19OcubqV5w
April 1, 2024
248866
Sri Lanka
LKA
true
2
1
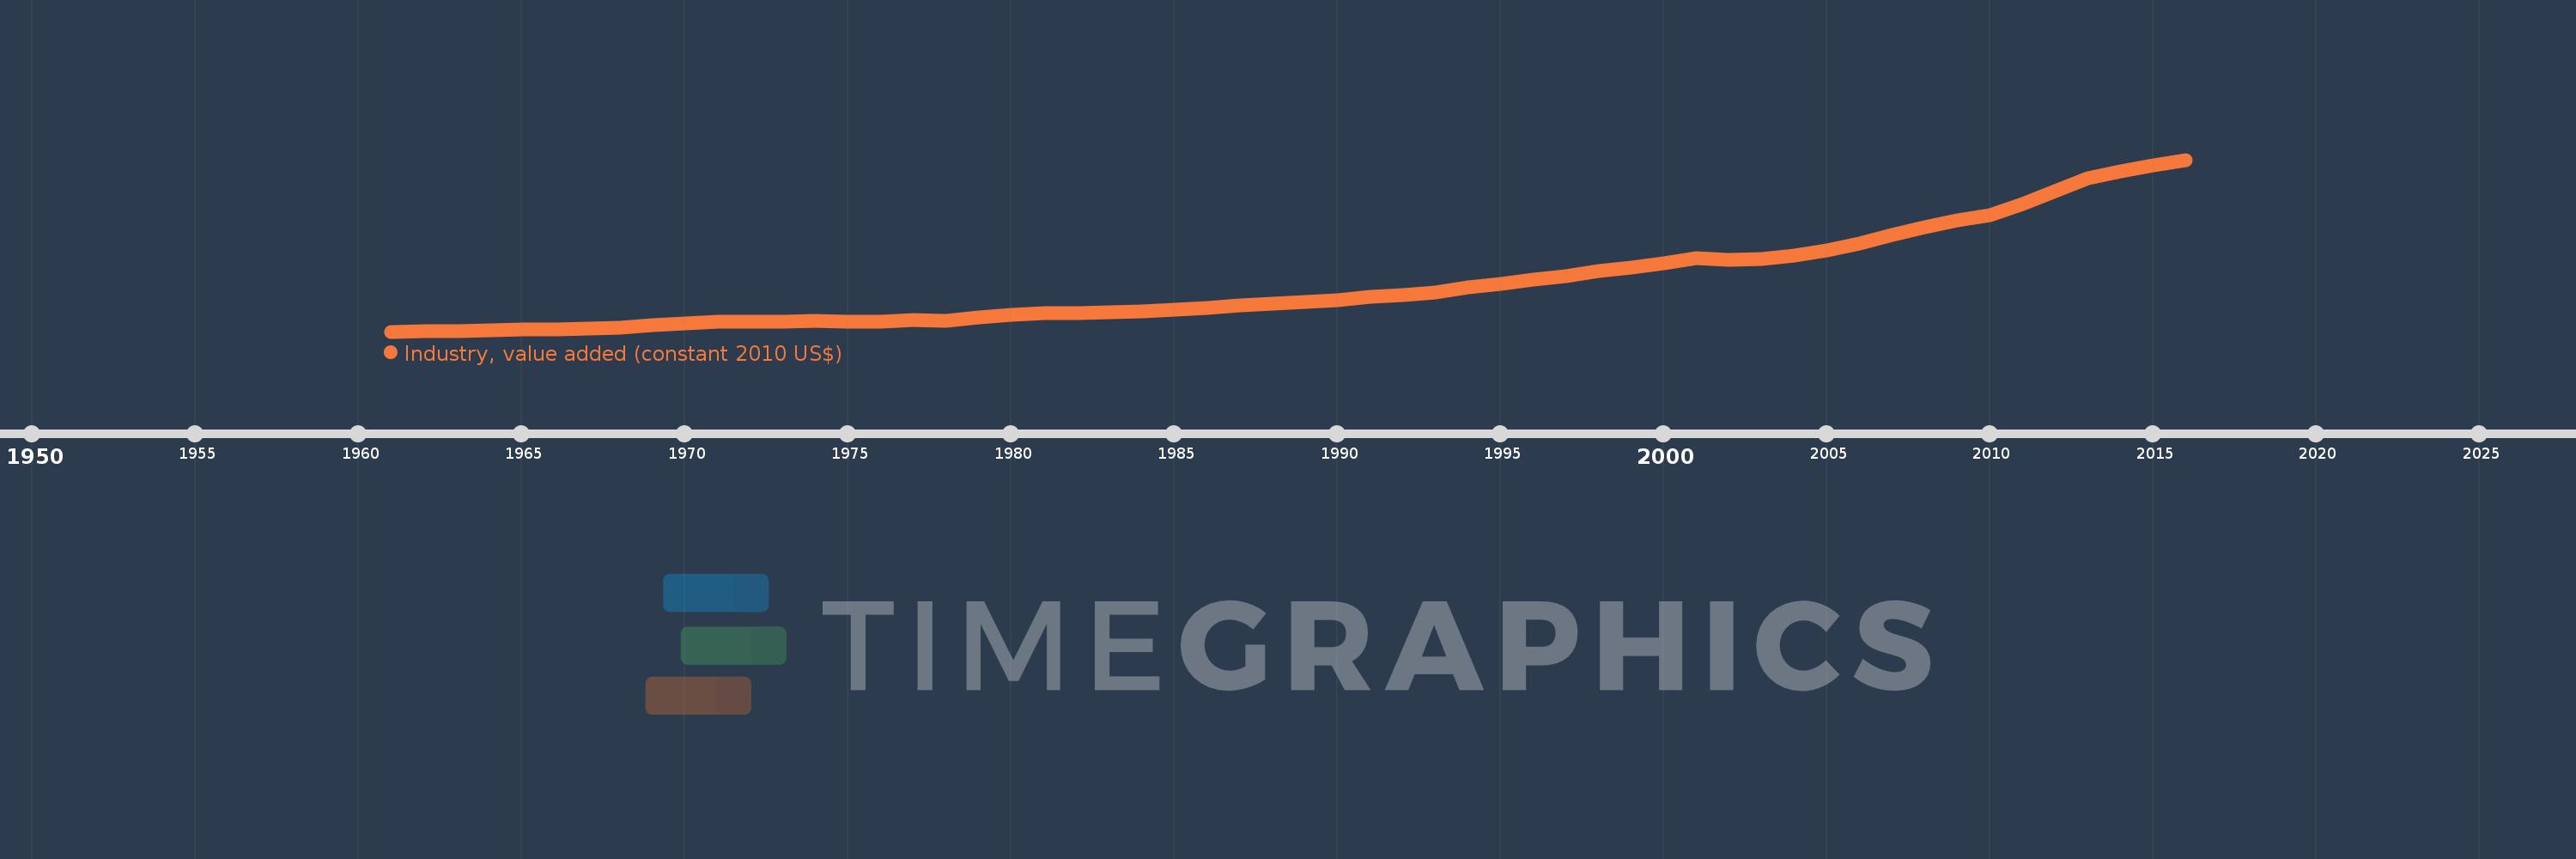
Industry, value added (constant 2010 US$)
2016,2015,2014,2013,2012,2011,2010,2009,2008,2007,2006,2005,2004,2003,2002,2001,2000,1999,1998,1997,1996,1995,1994,1993,1992,1991,1990,1989,1988,1987,1986,1985,1984,1983,1982,1981,1980,1979,1978,1977,1976,1975,1974,1973,1972,1971,1970,1969,1968,1967,1966,1965,1964,1963,1962,1961
This statistics in other country:
AfghanistanAlbaniaAlgeriaAndorraAntigua and BarbudaArab WorldArgentinaArmeniaArubaAustraliaAustriaAzerbaijanBahamas, TheBahrainBangladeshBarbadosBelarusBelgiumBelizeBeninBermudaBhutanBoliviaBosnia and HerzegovinaBotswanaBrazilBrunei DarussalamBulgariaBurkina FasoBurundiCabo VerdeCambodiaCameroonCanadaCaribbean small statesCentral African RepublicCentral Europe and the BalticsChadChileChinaColombiaComorosCongo, Dem. Rep.Congo, Rep.Costa RicaCote d'IvoireCroatiaCubaCyprusCzech RepublicDenmarkDominicaDominican RepublicEarly-demographic dividendEast Asia & PacificEast Asia & Pacific (excluding high income)East Asia & Pacific (IDA & IBRD countries)EcuadorEgypt, Arab Rep.El SalvadorEquatorial GuineaEstoniaEthiopiaEuro areaEurope & Central AsiaEurope & Central Asia (excluding high income)Europe & Central Asia (IDA & IBRD countries)European UnionFijiFinlandFragile and conflict affected situationsFranceGabonGambia, TheGeorgiaGermanyGhanaGreeceGrenadaGuatemalaGuineaGuinea-BissauGuyanaHeavily indebted poor countries (HIPC)High incomeHondurasHong Kong SAR, ChinaHungaryIBRD onlyIcelandIDA & IBRD totalIDA blendIDA onlyIDA totalIndiaIndonesiaIran, Islamic Rep.IraqIrelandItalyJamaicaJapanJordanKazakhstanKenyaKiribatiKorea, Rep.KosovoKuwaitKyrgyz RepublicLao PDRLate-demographic dividendLatin America & Caribbean Latin America & Caribbean (excluding high income)Latin America & the Caribbean (IDA & IBRD countries)LatviaLeast developed countries: UN classificationLebanonLesothoLiberiaLiechtensteinLithuaniaLow & middle incomeLow incomeLower middle incomeLuxembourgMacao SAR, ChinaMacedonia, FYRMadagascarMalawiMalaysiaMaldivesMaliMaltaMarshall IslandsMauritaniaMauritiusMexicoMicronesia, Fed. Sts.Middle East & North AfricaMiddle East & North Africa (excluding high income)Middle East & North Africa (IDA & IBRD countries)Middle incomeMoldovaMongoliaMontenegroMoroccoMozambiqueMyanmarNamibiaNepalNetherlandsNew ZealandNicaraguaNigerNigeriaNorth AmericaNorwayOECD membersOmanOther small statesPacific island small statesPakistanPalauPanamaParaguayPeruPhilippinesPolandPortugalPost-demographic dividendPre-demographic dividendPuerto RicoQatarRomaniaRussian FederationRwandaSamoaSao Tome and PrincipeSaudi ArabiaSenegalSerbiaSeychellesSierra LeoneSingaporeSlovak RepublicSloveniaSmall statesSouth AfricaSouth AsiaSouth Asia (IDA & IBRD)SpainSri LankaSt. Kitts and NevisSt. LuciaSt. Vincent and the GrenadinesSub-Saharan Africa Sub-Saharan Africa (excluding high income)Sub-Saharan Africa (IDA & IBRD countries)SudanSurinameSwazilandSwedenSwitzerlandTajikistanTanzaniaThailandTimor-LesteTogoTongaTrinidad and TobagoTunisiaTurkeyTurkmenistanTuvaluUgandaUkraineUnited Arab EmiratesUnited KingdomUnited StatesUpper middle incomeUruguayUzbekistanVanuatuVenezuela, RBVietnamWest Bank and GazaWorldYemen, Rep.ZambiaZimbabwe Timeline:
This timeline shows a graph from 1961 to 2016 of Sri Lanka. No data until 1960. Number of actual observations by date: 56.
Source name:
World Development Indicators
Source organization:
World Bank national accounts data, and OECD National Accounts data files.
Categories, topics:
Economy & Growth
Last updated:
apr 23, 2017
Indicators value changes by year
Minimum:
1.174 bln
jan 1, 1961
Maximum:
19.982 bln
jan 1, 2016
At the date of observation
Value
Absolute change
Change from previous value
jan 1, 1961
1.174 bln
+1.174 bln
0.0%
jan 1, 1962
1.182 bln
+8.058 mln
0.69%
jan 1, 1963
1.254 bln
+71.88 mln
6.08%
jan 1, 1964
1.298 bln
+44.107 mln
3.52%
jan 1, 1965
1.366 bln
+67.55 mln
5.2%
jan 1, 1966
1.374 bln
+7.758 mln
0.57%
jan 1, 1967
1.486 bln
+112.212 mln
8.17%
jan 1, 1968
1.619 bln
+132.697 mln
8.93%
jan 1, 1969
1.872 bln
+253.776 mln
15.68%
jan 1, 1970
2.065 bln
+192.689 mln
10.29%
jan 1, 1971
2.257 bln
+191.996 mln
9.3%
jan 1, 1972
2.26 bln
+3.204 mln
0.14%
jan 1, 1973
2.229 bln
-31.109 mln
-1.38%
jan 1, 1974
2.36 bln
+130.503 mln
5.85%
jan 1, 1975
2.269 bln
-90.655 mln
-3.84%
jan 1, 1976
2.301 bln
+32.382 mln
1.43%
jan 1, 1977
2.483 bln
+182.011 mln
7.91%
jan 1, 1978
2.386 bln
-97.823 mln
-3.94%
jan 1, 1979
2.745 bln
+359.236 mln
15.06%
jan 1, 1980
3.023 bln
+277.874 mln
10.12%
jan 1, 1981
3.165 bln
+142.658 mln
4.72%
jan 1, 1982
3.239 bln
+73.943 mln
2.34%
jan 1, 1983
3.316 bln
+76.941 mln
2.38%
jan 1, 1984
3.369 bln
+52.536 mln
1.58%
jan 1, 1985
3.599 bln
+230.625 mln
6.85%
jan 1, 1986
3.778 bln
+178.576 mln
4.96%
jan 1, 1987
4.008 bln
+229.961 mln
6.09%
jan 1, 1988
4.255 bln
+246.997 mln
6.16%
jan 1, 1989
4.436 bln
+180.92 mln
4.25%
jan 1, 1990
4.583 bln
+147.361 mln
3.32%
jan 1, 1991
4.938 bln
+354.483 mln
7.73%
jan 1, 1992
5.125 bln
+187.229 mln
3.79%
jan 1, 1993
5.461 bln
+335.69 mln
6.55%
jan 1, 1994
5.972 bln
+511.02 mln
9.36%
jan 1, 1995
6.44 bln
+467.902 mln
7.84%
jan 1, 1996
6.886 bln
+446.239 mln
6.93%
jan 1, 1997
7.246 bln
+360.408 mln
5.23%
jan 1, 1998
7.782 bln
+536.003 mln
7.4%
jan 1, 1999
8.225 bln
+443.114 mln
5.69%
jan 1, 2000
8.619 bln
+393.83 mln
4.79%
jan 1, 2001
9.242 bln
+622.948 mln
7.23%
jan 1, 2002
9.034 bln
-208.081 mln
-2.25%
jan 1, 2003
9.109 bln
+75.446 mln
0.84%
jan 1, 2004
9.535 bln
+425.05 mln
4.67%
jan 1, 2005
10.05 bln
+515.946 mln
5.41%
jan 1, 2006
10.853 bln
+802.663 mln
7.99%
jan 1, 2007
11.734 bln
+880.944 mln
8.12%
jan 1, 2008
12.627 bln
+892.553 mln
7.61%
jan 1, 2009
13.374 bln
+747.263 mln
5.92%
jan 1, 2010
13.937 bln
+563.309 mln
4.21%
jan 1, 2011
15.114 bln
+1.177 bln
8.44%
jan 1, 2012
16.512 bln
+1.398 bln
9.25%
jan 1, 2013
18.004 bln
+1.492 bln
9.03%
jan 1, 2014
18.742 bln
+738.348 mln
4.1%
jan 1, 2015
19.406 bln
+664.081 mln
3.54%
jan 1, 2016
19.982 bln
+575.388 mln
2.96%
Ranking of countries by current statistics by years


Comments: