29
/
en
AIzaSyAYiBZKx7MnpbEhh9jyipgxe19OcubqV5w
April 1, 2024
34299
Fragile and conflict affected situations
FCS
false
2
1
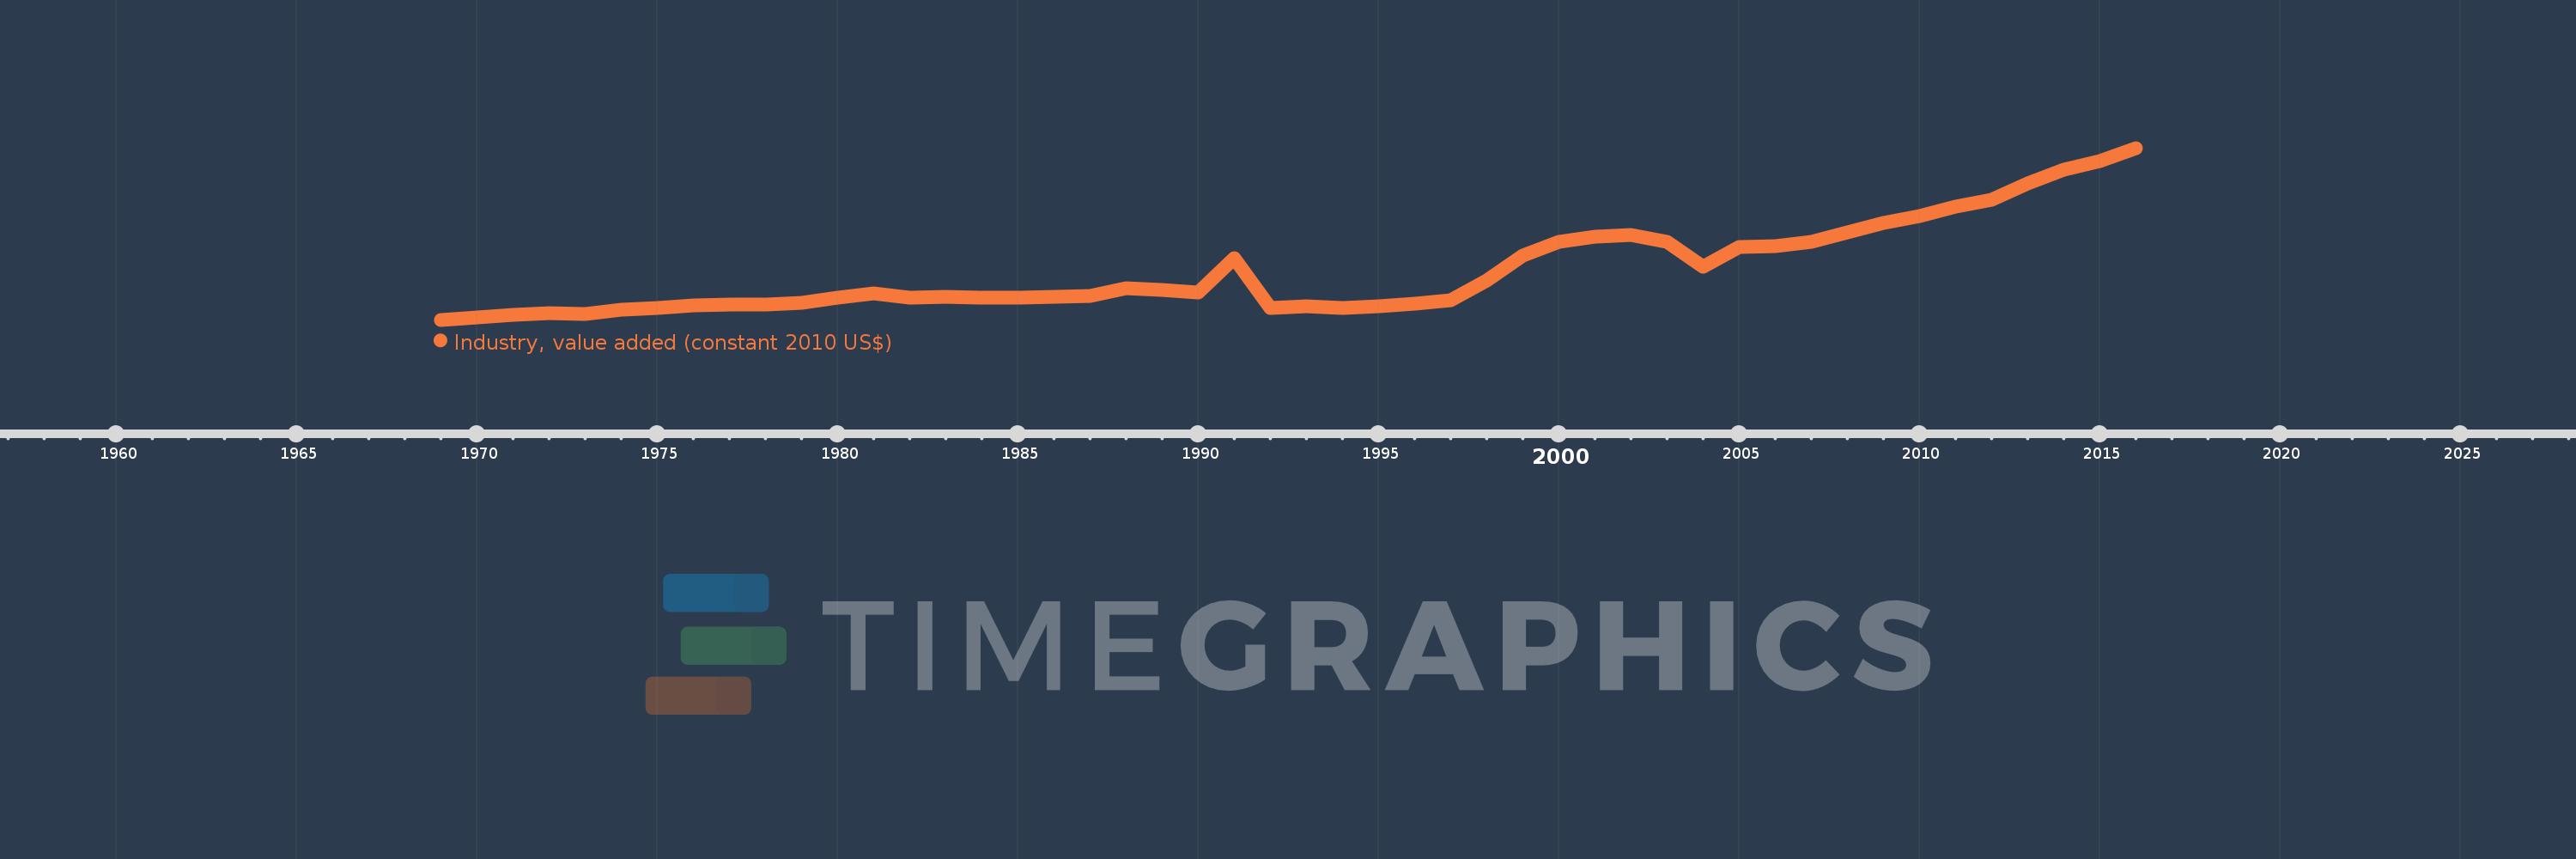
Industry, value added (constant 2010 US$)
2016,2015,2014,2013,2012,2011,2010,2009,2008,2007,2006,2005,2004,2003,2002,2001,2000,1999,1998,1997,1996,1995,1994,1993,1992,1991,1990,1989,1988,1987,1986,1985,1984,1983,1982,1981,1980,1979,1978,1977,1976,1975,1974,1973,1972,1971,1970,1969
This statistics in other country:
AfghanistanAlbaniaAlgeriaAndorraAntigua and BarbudaArab WorldArgentinaArmeniaArubaAustraliaAustriaAzerbaijanBahamas, TheBahrainBangladeshBarbadosBelarusBelgiumBelizeBeninBermudaBhutanBoliviaBosnia and HerzegovinaBotswanaBrazilBrunei DarussalamBulgariaBurkina FasoBurundiCabo VerdeCambodiaCameroonCanadaCaribbean small statesCentral African RepublicCentral Europe and the BalticsChadChileChinaColombiaComorosCongo, Dem. Rep.Congo, Rep.Costa RicaCote d'IvoireCroatiaCubaCyprusCzech RepublicDenmarkDominicaDominican RepublicEarly-demographic dividendEast Asia & PacificEast Asia & Pacific (excluding high income)East Asia & Pacific (IDA & IBRD countries)EcuadorEgypt, Arab Rep.El SalvadorEquatorial GuineaEstoniaEthiopiaEuro areaEurope & Central AsiaEurope & Central Asia (excluding high income)Europe & Central Asia (IDA & IBRD countries)European UnionFijiFinlandFragile and conflict affected situationsFranceGabonGambia, TheGeorgiaGermanyGhanaGreeceGrenadaGuatemalaGuineaGuinea-BissauGuyanaHeavily indebted poor countries (HIPC)High incomeHondurasHong Kong SAR, ChinaHungaryIBRD onlyIcelandIDA & IBRD totalIDA blendIDA onlyIDA totalIndiaIndonesiaIran, Islamic Rep.IraqIrelandItalyJamaicaJapanJordanKazakhstanKenyaKiribatiKorea, Rep.KosovoKuwaitKyrgyz RepublicLao PDRLate-demographic dividendLatin America & Caribbean Latin America & Caribbean (excluding high income)Latin America & the Caribbean (IDA & IBRD countries)LatviaLeast developed countries: UN classificationLebanonLesothoLiberiaLiechtensteinLithuaniaLow & middle incomeLow incomeLower middle incomeLuxembourgMacao SAR, ChinaMacedonia, FYRMadagascarMalawiMalaysiaMaldivesMaliMaltaMarshall IslandsMauritaniaMauritiusMexicoMicronesia, Fed. Sts.Middle East & North AfricaMiddle East & North Africa (excluding high income)Middle East & North Africa (IDA & IBRD countries)Middle incomeMoldovaMongoliaMontenegroMoroccoMozambiqueMyanmarNamibiaNepalNetherlandsNew ZealandNicaraguaNigerNigeriaNorth AmericaNorwayOECD membersOmanOther small statesPacific island small statesPakistanPalauPanamaParaguayPeruPhilippinesPolandPortugalPost-demographic dividendPre-demographic dividendPuerto RicoQatarRomaniaRussian FederationRwandaSamoaSao Tome and PrincipeSaudi ArabiaSenegalSerbiaSeychellesSierra LeoneSingaporeSlovak RepublicSloveniaSmall statesSouth AfricaSouth AsiaSouth Asia (IDA & IBRD)SpainSri LankaSt. Kitts and NevisSt. LuciaSt. Vincent and the GrenadinesSub-Saharan Africa Sub-Saharan Africa (excluding high income)Sub-Saharan Africa (IDA & IBRD countries)SudanSurinameSwazilandSwedenSwitzerlandTajikistanTanzaniaThailandTimor-LesteTogoTongaTrinidad and TobagoTunisiaTurkeyTurkmenistanTuvaluUgandaUkraineUnited Arab EmiratesUnited KingdomUnited StatesUpper middle incomeUruguayUzbekistanVanuatuVenezuela, RBVietnamWest Bank and GazaWorldYemen, Rep.ZambiaZimbabwe Timeline:
This timeline shows a graph from 1969 to 2016 of Fragile and conflict affected situations. No data until 1968. Number of actual observations by date: 48.
Source name:
World Development Indicators
Source organization:
World Bank national accounts data, and OECD National Accounts data files.
Categories, topics:
Economy & Growth
Last updated:
apr 23, 2017
Indicators value changes by year
Minimum:
35.136 bln
jan 1, 1969
Maximum:
292.123 bln
jan 1, 2016
At the date of observation
Value
Absolute change
Change from previous value
jan 1, 1969
35.136 bln
+35.136 bln
0.0%
jan 1, 1970
38.149 bln
+3.013 bln
8.57%
jan 1, 1971
42.418 bln
+4.268 bln
11.19%
jan 1, 1972
44.796 bln
+2.379 bln
5.61%
jan 1, 1973
43.41 bln
-1.386 bln
-3.09%
jan 1, 1974
49.912 bln
+6.501 bln
14.98%
jan 1, 1975
53.38 bln
+3.469 bln
6.95%
jan 1, 1976
56.083 bln
+2.703 bln
5.06%
jan 1, 1977
58.501 bln
+2.418 bln
4.31%
jan 1, 1978
57.534 bln
-967.013 mln
-1.65%
jan 1, 1979
60.553 bln
+3.02 bln
5.25%
jan 1, 1980
67.832 bln
+7.279 bln
12.02%
jan 1, 1981
75.172 bln
+7.34 bln
10.82%
jan 1, 1982
68.508 bln
-6.664 bln
-8.87%
jan 1, 1983
69.691 bln
+1.183 bln
1.73%
jan 1, 1984
68.449 bln
-1.242 bln
-1.78%
jan 1, 1985
68.577 bln
+127.328 mln
0.19%
jan 1, 1986
68.992 bln
+415.131 mln
0.61%
jan 1, 1987
71.261 bln
+2.27 bln
3.29%
jan 1, 1988
82.93 bln
+11.668 bln
16.37%
jan 1, 1989
80.02 bln
-2.91 bln
-3.51%
jan 1, 1990
75.929 bln
-4.09 bln
-5.11%
jan 1, 1991
127.002 bln
+51.072 bln
67.26%
jan 1, 1992
52.446 bln
-74.556 bln
-58.7%
jan 1, 1993
54.887 bln
+2.441 bln
4.65%
jan 1, 1994
52.451 bln
-2.436 bln
-4.44%
jan 1, 1995
55.773 bln
+3.323 bln
6.33%
jan 1, 1996
58.754 bln
+2.98 bln
5.34%
jan 1, 1997
63.708 bln
+4.954 bln
8.43%
jan 1, 1998
94.342 bln
+30.634 bln
48.09%
jan 1, 1999
130.707 bln
+36.364 bln
38.55%
jan 1, 2000
151.952 bln
+21.246 bln
16.25%
jan 1, 2001
158.906 bln
+6.953 bln
4.58%
jan 1, 2002
162.093 bln
+3.187 bln
2.01%
jan 1, 2003
151.222 bln
-10.87 bln
-6.71%
jan 1, 2004
114.351 bln
-36.871 bln
-24.38%
jan 1, 2005
143.93 bln
+29.579 bln
25.87%
jan 1, 2006
145.655 bln
+1.725 bln
1.2%
jan 1, 2007
151.532 bln
+5.877 bln
4.03%
jan 1, 2008
166.182 bln
+14.65 bln
9.67%
jan 1, 2009
180.304 bln
+14.122 bln
8.5%
jan 1, 2010
189.645 bln
+9.34 bln
5.18%
jan 1, 2011
204.213 bln
+14.568 bln
7.68%
jan 1, 2012
214.479 bln
+10.266 bln
5.03%
jan 1, 2013
239.518 bln
+25.039 bln
11.67%
jan 1, 2014
259.981 bln
+20.463 bln
8.54%
jan 1, 2015
272.638 bln
+12.657 bln
4.87%
jan 1, 2016
292.123 bln
+19.485 bln
7.15%
Ranking of countries by current statistics by years


Comments: