29
/
en
AIzaSyAYiBZKx7MnpbEhh9jyipgxe19OcubqV5w
April 1, 2024
51012
Middle income
MIC
false
2
1
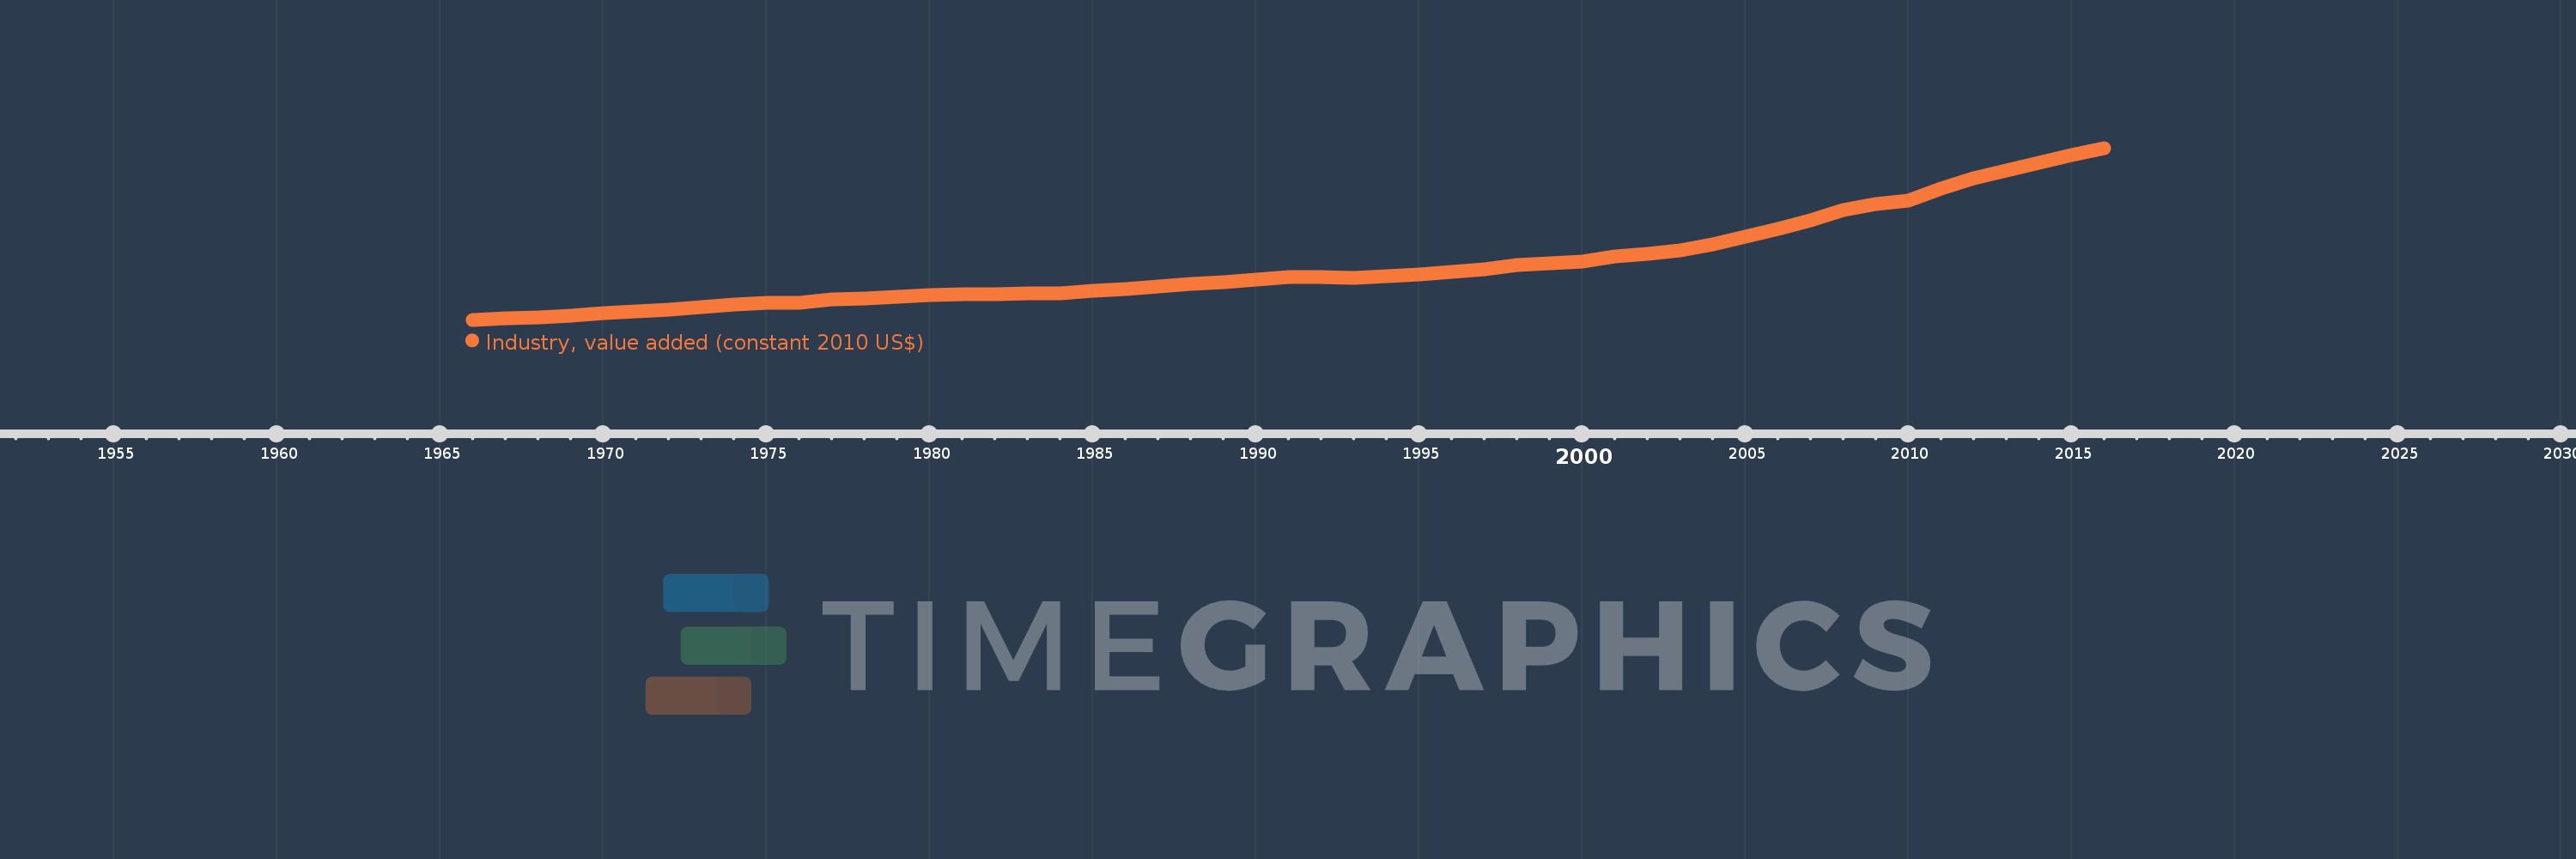
Industry, value added (constant 2010 US$)
2016,2015,2014,2013,2012,2011,2010,2009,2008,2007,2006,2005,2004,2003,2002,2001,2000,1999,1998,1997,1996,1995,1994,1993,1992,1991,1990,1989,1988,1987,1986,1985,1984,1983,1982,1981,1980,1979,1978,1977,1976,1975,1974,1973,1972,1971,1970,1969,1968,1967,1966
This statistics in other country:
AfghanistanAlbaniaAlgeriaAndorraAntigua and BarbudaArab WorldArgentinaArmeniaArubaAustraliaAustriaAzerbaijanBahamas, TheBahrainBangladeshBarbadosBelarusBelgiumBelizeBeninBermudaBhutanBoliviaBosnia and HerzegovinaBotswanaBrazilBrunei DarussalamBulgariaBurkina FasoBurundiCabo VerdeCambodiaCameroonCanadaCaribbean small statesCentral African RepublicCentral Europe and the BalticsChadChileChinaColombiaComorosCongo, Dem. Rep.Congo, Rep.Costa RicaCote d'IvoireCroatiaCubaCyprusCzech RepublicDenmarkDominicaDominican RepublicEarly-demographic dividendEast Asia & PacificEast Asia & Pacific (excluding high income)East Asia & Pacific (IDA & IBRD countries)EcuadorEgypt, Arab Rep.El SalvadorEquatorial GuineaEstoniaEthiopiaEuro areaEurope & Central AsiaEurope & Central Asia (excluding high income)Europe & Central Asia (IDA & IBRD countries)European UnionFijiFinlandFragile and conflict affected situationsFranceGabonGambia, TheGeorgiaGermanyGhanaGreeceGrenadaGuatemalaGuineaGuinea-BissauGuyanaHeavily indebted poor countries (HIPC)High incomeHondurasHong Kong SAR, ChinaHungaryIBRD onlyIcelandIDA & IBRD totalIDA blendIDA onlyIDA totalIndiaIndonesiaIran, Islamic Rep.IraqIrelandItalyJamaicaJapanJordanKazakhstanKenyaKiribatiKorea, Rep.KosovoKuwaitKyrgyz RepublicLao PDRLate-demographic dividendLatin America & Caribbean Latin America & Caribbean (excluding high income)Latin America & the Caribbean (IDA & IBRD countries)LatviaLeast developed countries: UN classificationLebanonLesothoLiberiaLiechtensteinLithuaniaLow & middle incomeLow incomeLower middle incomeLuxembourgMacao SAR, ChinaMacedonia, FYRMadagascarMalawiMalaysiaMaldivesMaliMaltaMarshall IslandsMauritaniaMauritiusMexicoMicronesia, Fed. Sts.Middle East & North AfricaMiddle East & North Africa (excluding high income)Middle East & North Africa (IDA & IBRD countries)Middle incomeMoldovaMongoliaMontenegroMoroccoMozambiqueMyanmarNamibiaNepalNetherlandsNew ZealandNicaraguaNigerNigeriaNorth AmericaNorwayOECD membersOmanOther small statesPacific island small statesPakistanPalauPanamaParaguayPeruPhilippinesPolandPortugalPost-demographic dividendPre-demographic dividendPuerto RicoQatarRomaniaRussian FederationRwandaSamoaSao Tome and PrincipeSaudi ArabiaSenegalSerbiaSeychellesSierra LeoneSingaporeSlovak RepublicSloveniaSmall statesSouth AfricaSouth AsiaSouth Asia (IDA & IBRD)SpainSri LankaSt. Kitts and NevisSt. LuciaSt. Vincent and the GrenadinesSub-Saharan Africa Sub-Saharan Africa (excluding high income)Sub-Saharan Africa (IDA & IBRD countries)SudanSurinameSwazilandSwedenSwitzerlandTajikistanTanzaniaThailandTimor-LesteTogoTongaTrinidad and TobagoTunisiaTurkeyTurkmenistanTuvaluUgandaUkraineUnited Arab EmiratesUnited KingdomUnited StatesUpper middle incomeUruguayUzbekistanVanuatuVenezuela, RBVietnamWest Bank and GazaWorldYemen, Rep.ZambiaZimbabwe Timeline:
This timeline shows a graph from 1966 to 2016 of Middle income. No data until 1965. Number of actual observations by date: 51.
Source name:
World Development Indicators
Source organization:
World Bank national accounts data, and OECD National Accounts data files.
Categories, topics:
Economy & Growth
Last updated:
apr 23, 2017
Indicators value changes by year
Minimum:
911.608 bln
jan 1, 1966
Maximum:
9.255 trl
jan 1, 2016
At the date of observation
Value
Absolute change
Change from previous value
jan 1, 1966
911.608 bln
+911.608 bln
0.0%
jan 1, 1967
983.956 bln
+72.348 bln
7.94%
jan 1, 1968
1.029 trl
+45.456 bln
4.62%
jan 1, 1969
1.119 trl
+89.425 bln
8.69%
jan 1, 1970
1.218 trl
+99.354 bln
8.88%
jan 1, 1971
1.326 trl
+108.234 bln
8.88%
jan 1, 1972
1.399 trl
+72.241 bln
5.45%
jan 1, 1973
1.518 trl
+119.511 bln
8.54%
jan 1, 1974
1.668 trl
+149.843 bln
9.87%
jan 1, 1975
1.717 trl
+48.605 bln
2.91%
jan 1, 1976
1.74 trl
+23.78 bln
1.39%
jan 1, 1977
1.895 trl
+154.416 bln
8.87%
jan 1, 1978
1.956 trl
+60.817 bln
3.21%
jan 1, 1979
2.033 trl
+77.47 bln
3.96%
jan 1, 1980
2.105 trl
+72.157 bln
3.55%
jan 1, 1981
2.139 trl
+33.936 bln
1.61%
jan 1, 1982
2.14 trl
+1.262 bln
0.06%
jan 1, 1983
2.186 trl
+46.021 bln
2.15%
jan 1, 1984
2.187 trl
+583.1 mln
0.03%
jan 1, 1985
2.307 trl
+119.734 bln
5.47%
jan 1, 1986
2.406 trl
+98.978 bln
4.29%
jan 1, 1987
2.53 trl
+123.789 bln
5.15%
jan 1, 1988
2.648 trl
+118.409 bln
4.68%
jan 1, 1989
2.751 trl
+102.623 bln
3.88%
jan 1, 1990
2.842 trl
+91.558 bln
3.33%
jan 1, 1991
2.979 trl
+136.523 bln
4.8%
jan 1, 1992
2.971 trl
-7.614 bln
-0.26%
jan 1, 1993
2.953 trl
-18.562 bln
-0.62%
jan 1, 1994
3.02 trl
+67.084 bln
2.27%
jan 1, 1995
3.096 trl
+76.222 bln
2.52%
jan 1, 1996
3.234 trl
+137.858 bln
4.45%
jan 1, 1997
3.375 trl
+141.75 bln
4.38%
jan 1, 1998
3.569 trl
+193.986 bln
5.75%
jan 1, 1999
3.633 trl
+63.616 bln
1.78%
jan 1, 2000
3.738 trl
+105.143 bln
2.89%
jan 1, 2001
3.986 trl
+247.926 bln
6.63%
jan 1, 2002
4.111 trl
+124.686 bln
3.13%
jan 1, 2003
4.287 trl
+176.222 bln
4.29%
jan 1, 2004
4.553 trl
+265.843 bln
6.2%
jan 1, 2005
4.959 trl
+406.346 bln
8.93%
jan 1, 2006
5.308 trl
+348.729 bln
7.03%
jan 1, 2007
5.736 trl
+428.091 bln
8.07%
jan 1, 2008
6.218 trl
+482.199 bln
8.41%
jan 1, 2009
6.547 trl
+329.016 bln
5.29%
jan 1, 2010
6.695 trl
+147.937 bln
2.26%
jan 1, 2011
7.28 trl
+584.947 bln
8.74%
jan 1, 2012
7.788 trl
+507.771 bln
6.97%
jan 1, 2013
8.157 trl
+368.818 bln
4.74%
jan 1, 2014
8.546 trl
+389.395 bln
4.77%
jan 1, 2015
8.928 trl
+381.902 bln
4.47%
jan 1, 2016
9.255 trl
+326.722 bln
3.66%
Ranking of countries by current statistics by years


Comments: