29
/
en
AIzaSyAYiBZKx7MnpbEhh9jyipgxe19OcubqV5w
April 1, 2024
49108
Middle East & North Africa (excluding high income)
MNA
false
2
1
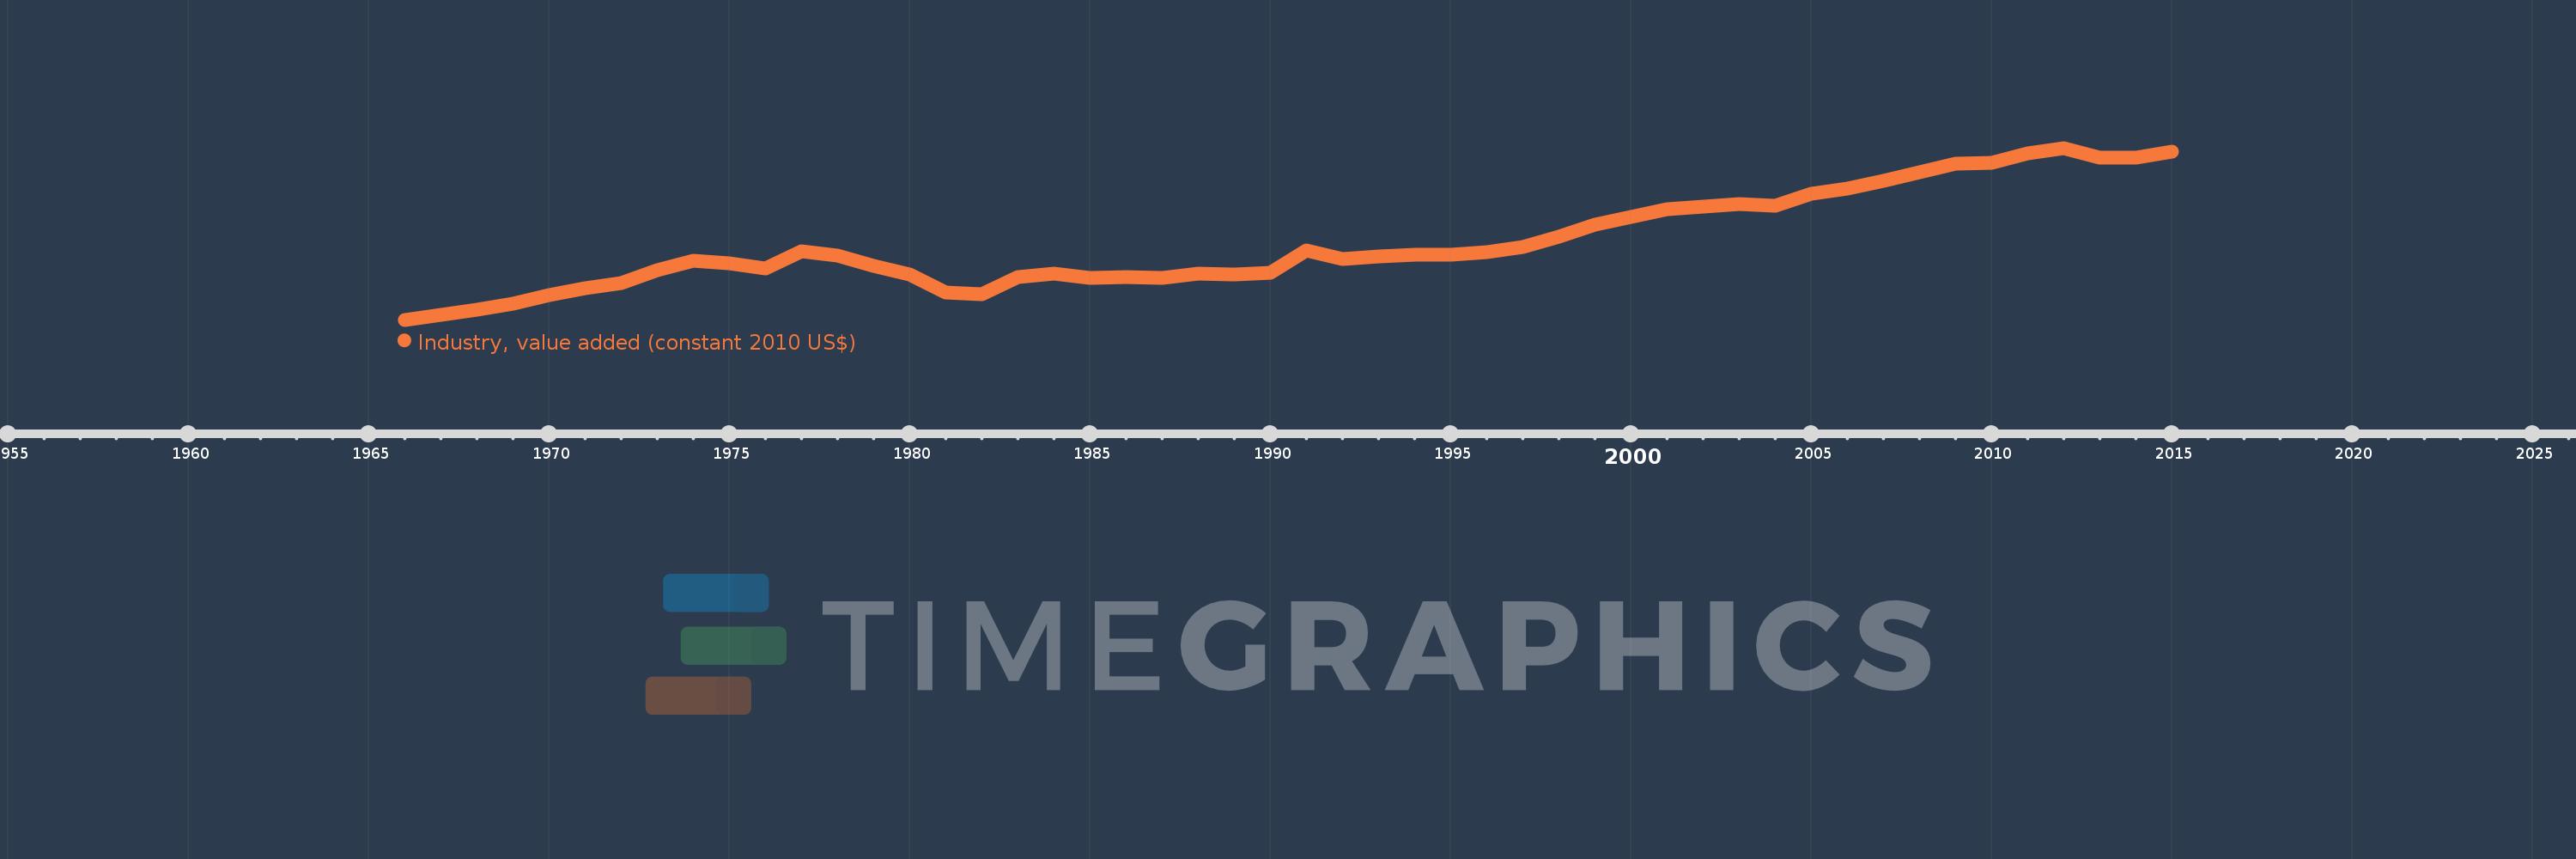
Industry, value added (constant 2010 US$)
2015,2014,2013,2012,2011,2010,2009,2008,2007,2006,2005,2004,2003,2002,2001,2000,1999,1998,1997,1996,1995,1994,1993,1992,1991,1990,1989,1988,1987,1986,1985,1984,1983,1982,1981,1980,1979,1978,1977,1976,1975,1974,1973,1972,1971,1970,1969,1968,1967,1966
This statistics in other country:
AfghanistanAlbaniaAlgeriaAndorraAntigua and BarbudaArab WorldArgentinaArmeniaArubaAustraliaAustriaAzerbaijanBahamas, TheBahrainBangladeshBarbadosBelarusBelgiumBelizeBeninBermudaBhutanBoliviaBosnia and HerzegovinaBotswanaBrazilBrunei DarussalamBulgariaBurkina FasoBurundiCabo VerdeCambodiaCameroonCanadaCaribbean small statesCentral African RepublicCentral Europe and the BalticsChadChileChinaColombiaComorosCongo, Dem. Rep.Congo, Rep.Costa RicaCote d'IvoireCroatiaCubaCyprusCzech RepublicDenmarkDominicaDominican RepublicEarly-demographic dividendEast Asia & PacificEast Asia & Pacific (excluding high income)East Asia & Pacific (IDA & IBRD countries)EcuadorEgypt, Arab Rep.El SalvadorEquatorial GuineaEstoniaEthiopiaEuro areaEurope & Central AsiaEurope & Central Asia (excluding high income)Europe & Central Asia (IDA & IBRD countries)European UnionFijiFinlandFragile and conflict affected situationsFranceGabonGambia, TheGeorgiaGermanyGhanaGreeceGrenadaGuatemalaGuineaGuinea-BissauGuyanaHeavily indebted poor countries (HIPC)High incomeHondurasHong Kong SAR, ChinaHungaryIBRD onlyIcelandIDA & IBRD totalIDA blendIDA onlyIDA totalIndiaIndonesiaIran, Islamic Rep.IraqIrelandItalyJamaicaJapanJordanKazakhstanKenyaKiribatiKorea, Rep.KosovoKuwaitKyrgyz RepublicLao PDRLate-demographic dividendLatin America & Caribbean Latin America & Caribbean (excluding high income)Latin America & the Caribbean (IDA & IBRD countries)LatviaLeast developed countries: UN classificationLebanonLesothoLiberiaLiechtensteinLithuaniaLow & middle incomeLow incomeLower middle incomeLuxembourgMacao SAR, ChinaMacedonia, FYRMadagascarMalawiMalaysiaMaldivesMaliMaltaMarshall IslandsMauritaniaMauritiusMexicoMicronesia, Fed. Sts.Middle East & North AfricaMiddle East & North Africa (excluding high income)Middle East & North Africa (IDA & IBRD countries)Middle incomeMoldovaMongoliaMontenegroMoroccoMozambiqueMyanmarNamibiaNepalNetherlandsNew ZealandNicaraguaNigerNigeriaNorth AmericaNorwayOECD membersOmanOther small statesPacific island small statesPakistanPalauPanamaParaguayPeruPhilippinesPolandPortugalPost-demographic dividendPre-demographic dividendPuerto RicoQatarRomaniaRussian FederationRwandaSamoaSao Tome and PrincipeSaudi ArabiaSenegalSerbiaSeychellesSierra LeoneSingaporeSlovak RepublicSloveniaSmall statesSouth AfricaSouth AsiaSouth Asia (IDA & IBRD)SpainSri LankaSt. Kitts and NevisSt. LuciaSt. Vincent and the GrenadinesSub-Saharan Africa Sub-Saharan Africa (excluding high income)Sub-Saharan Africa (IDA & IBRD countries)SudanSurinameSwazilandSwedenSwitzerlandTajikistanTanzaniaThailandTimor-LesteTogoTongaTrinidad and TobagoTunisiaTurkeyTurkmenistanTuvaluUgandaUkraineUnited Arab EmiratesUnited KingdomUnited StatesUpper middle incomeUruguayUzbekistanVanuatuVenezuela, RBVietnamWest Bank and GazaWorldYemen, Rep.ZambiaZimbabwe Timeline:
This timeline shows a graph from 1966 to 2015 of Middle East & North Africa (excluding high income). No data until 1965. Number of actual observations by date: 50.
Source name:
World Development Indicators
Source organization:
World Bank national accounts data, and OECD National Accounts data files.
Categories, topics:
Economy & Growth
Last updated:
apr 23, 2017
Indicators value changes by year
Minimum:
103.165 bln
jan 1, 1966
Maximum:
543.171 bln
jan 1, 2012
At the date of observation
Value
Absolute change
Change from previous value
jan 1, 1966
103.165 bln
+103.165 bln
0.0%
jan 1, 1967
114.702 bln
+11.537 bln
11.18%
jan 1, 1968
127.929 bln
+13.226 bln
11.53%
jan 1, 1969
145.159 bln
+17.23 bln
13.47%
jan 1, 1970
166.675 bln
+21.516 bln
14.82%
jan 1, 1971
184.025 bln
+17.351 bln
10.41%
jan 1, 1972
196.888 bln
+12.863 bln
6.99%
jan 1, 1973
229.451 bln
+32.563 bln
16.54%
jan 1, 1974
253.872 bln
+24.421 bln
10.64%
jan 1, 1975
248.092 bln
-5.78 bln
-2.28%
jan 1, 1976
235.219 bln
-12.873 bln
-5.19%
jan 1, 1977
278.162 bln
+42.943 bln
18.26%
jan 1, 1978
267.713 bln
-10.449 bln
-3.76%
jan 1, 1979
241.205 bln
-26.508 bln
-9.9%
jan 1, 1980
219.717 bln
-21.488 bln
-8.91%
jan 1, 1981
172.658 bln
-47.059 bln
-21.42%
jan 1, 1982
168.666 bln
-3.992 bln
-2.31%
jan 1, 1983
212.097 bln
+43.431 bln
25.75%
jan 1, 1984
222.197 bln
+10.1 bln
4.76%
jan 1, 1985
210.376 bln
-11.821 bln
-5.32%
jan 1, 1986
213.533 bln
+3.157 bln
1.5%
jan 1, 1987
210.692 bln
-2.841 bln
-1.33%
jan 1, 1988
220.867 bln
+10.176 bln
4.83%
jan 1, 1989
219.379 bln
-1.489 bln
-0.67%
jan 1, 1990
223.54 bln
+4.161 bln
1.9%
jan 1, 1991
280.186 bln
+56.646 bln
25.34%
jan 1, 1992
258.523 bln
-21.662 bln
-7.73%
jan 1, 1993
266.086 bln
+7.563 bln
2.93%
jan 1, 1994
268.862 bln
+2.776 bln
1.04%
jan 1, 1995
268.638 bln
-224.472 mln
-0.08%
jan 1, 1996
275.861 bln
+7.223 bln
2.69%
jan 1, 1997
290.288 bln
+14.427 bln
5.23%
jan 1, 1998
315.64 bln
+25.352 bln
8.73%
jan 1, 1999
345.992 bln
+30.353 bln
9.62%
jan 1, 2000
367.389 bln
+21.396 bln
6.18%
jan 1, 2001
387.392 bln
+20.003 bln
5.44%
jan 1, 2002
391.836 bln
+4.444 bln
1.15%
jan 1, 2003
400.432 bln
+8.596 bln
2.19%
jan 1, 2004
394.903 bln
-5.529 bln
-1.38%
jan 1, 2005
425.306 bln
+30.403 bln
7.7%
jan 1, 2006
439.955 bln
+14.649 bln
3.44%
jan 1, 2007
457.945 bln
+17.991 bln
4.09%
jan 1, 2008
481.442 bln
+23.496 bln
5.13%
jan 1, 2009
503.503 bln
+22.062 bln
4.58%
jan 1, 2010
505.346 bln
+1.842 bln
0.37%
jan 1, 2011
530.236 bln
+24.89 bln
4.93%
jan 1, 2012
543.171 bln
+12.935 bln
2.44%
jan 1, 2013
519.218 bln
-23.953 bln
-4.41%
jan 1, 2014
518.57 bln
-647.931 mln
-0.12%
jan 1, 2015
533.783 bln
+15.213 bln
2.93%
Ranking of countries by current statistics by years


Comments: