29
/
en
AIzaSyAYiBZKx7MnpbEhh9jyipgxe19OcubqV5w
April 1, 2024
31695
Europe & Central Asia (excluding high income)
ECA
false
2
1
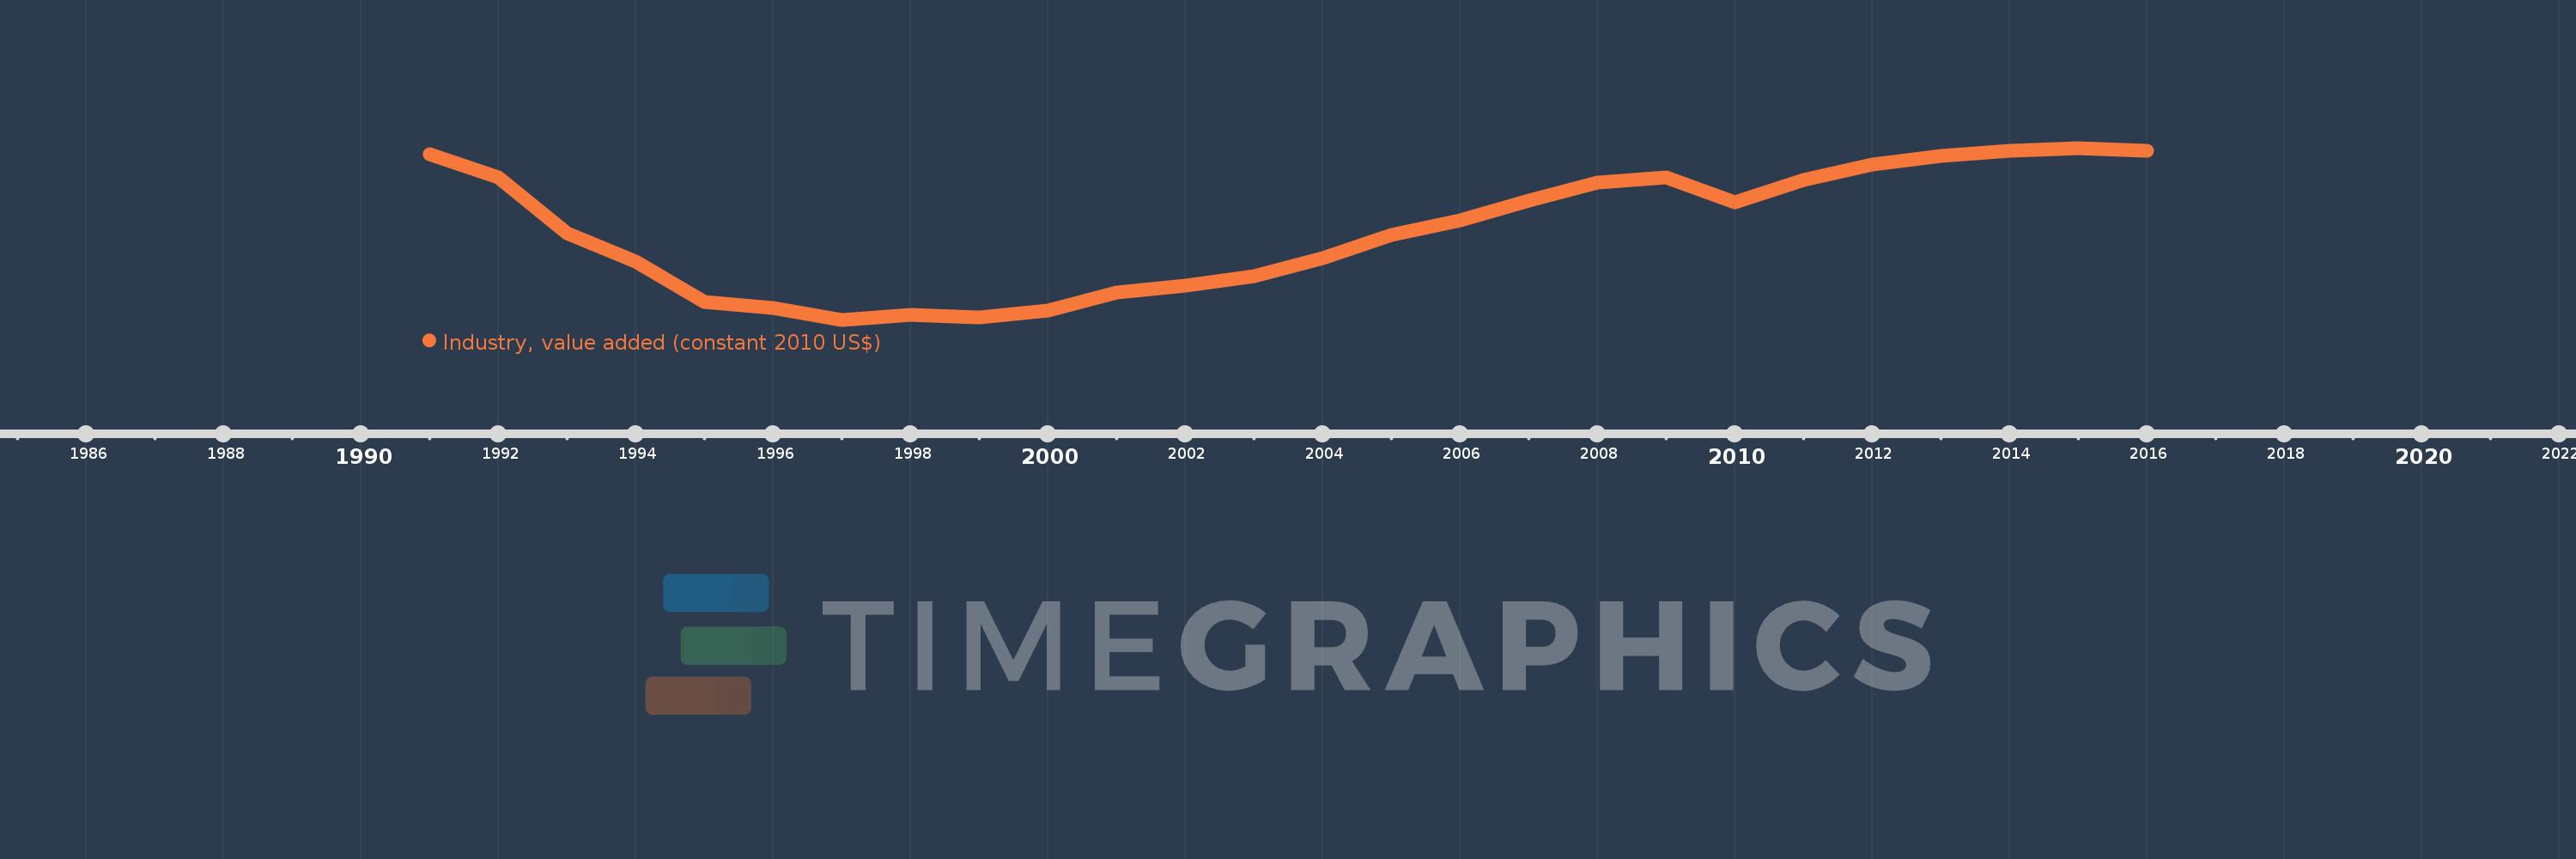
Industry, value added (constant 2010 US$)
2016,2015,2014,2013,2012,2011,2010,2009,2008,2007,2006,2005,2004,2003,2002,2001,2000,1999,1998,1997,1996,1995,1994,1993,1992,1991
This statistics in other country:
AfghanistanAlbaniaAlgeriaAndorraAntigua and BarbudaArab WorldArgentinaArmeniaArubaAustraliaAustriaAzerbaijanBahamas, TheBahrainBangladeshBarbadosBelarusBelgiumBelizeBeninBermudaBhutanBoliviaBosnia and HerzegovinaBotswanaBrazilBrunei DarussalamBulgariaBurkina FasoBurundiCabo VerdeCambodiaCameroonCanadaCaribbean small statesCentral African RepublicCentral Europe and the BalticsChadChileChinaColombiaComorosCongo, Dem. Rep.Congo, Rep.Costa RicaCote d'IvoireCroatiaCubaCyprusCzech RepublicDenmarkDominicaDominican RepublicEarly-demographic dividendEast Asia & PacificEast Asia & Pacific (excluding high income)East Asia & Pacific (IDA & IBRD countries)EcuadorEgypt, Arab Rep.El SalvadorEquatorial GuineaEstoniaEthiopiaEuro areaEurope & Central AsiaEurope & Central Asia (excluding high income)Europe & Central Asia (IDA & IBRD countries)European UnionFijiFinlandFragile and conflict affected situationsFranceGabonGambia, TheGeorgiaGermanyGhanaGreeceGrenadaGuatemalaGuineaGuinea-BissauGuyanaHeavily indebted poor countries (HIPC)High incomeHondurasHong Kong SAR, ChinaHungaryIBRD onlyIcelandIDA & IBRD totalIDA blendIDA onlyIDA totalIndiaIndonesiaIran, Islamic Rep.IraqIrelandItalyJamaicaJapanJordanKazakhstanKenyaKiribatiKorea, Rep.KosovoKuwaitKyrgyz RepublicLao PDRLate-demographic dividendLatin America & Caribbean Latin America & Caribbean (excluding high income)Latin America & the Caribbean (IDA & IBRD countries)LatviaLeast developed countries: UN classificationLebanonLesothoLiberiaLiechtensteinLithuaniaLow & middle incomeLow incomeLower middle incomeLuxembourgMacao SAR, ChinaMacedonia, FYRMadagascarMalawiMalaysiaMaldivesMaliMaltaMarshall IslandsMauritaniaMauritiusMexicoMicronesia, Fed. Sts.Middle East & North AfricaMiddle East & North Africa (excluding high income)Middle East & North Africa (IDA & IBRD countries)Middle incomeMoldovaMongoliaMontenegroMoroccoMozambiqueMyanmarNamibiaNepalNetherlandsNew ZealandNicaraguaNigerNigeriaNorth AmericaNorwayOECD membersOmanOther small statesPacific island small statesPakistanPalauPanamaParaguayPeruPhilippinesPolandPortugalPost-demographic dividendPre-demographic dividendPuerto RicoQatarRomaniaRussian FederationRwandaSamoaSao Tome and PrincipeSaudi ArabiaSenegalSerbiaSeychellesSierra LeoneSingaporeSlovak RepublicSloveniaSmall statesSouth AfricaSouth AsiaSouth Asia (IDA & IBRD)SpainSri LankaSt. Kitts and NevisSt. LuciaSt. Vincent and the GrenadinesSub-Saharan Africa Sub-Saharan Africa (excluding high income)Sub-Saharan Africa (IDA & IBRD countries)SudanSurinameSwazilandSwedenSwitzerlandTajikistanTanzaniaThailandTimor-LesteTogoTongaTrinidad and TobagoTunisiaTurkeyTurkmenistanTuvaluUgandaUkraineUnited Arab EmiratesUnited KingdomUnited StatesUpper middle incomeUruguayUzbekistanVanuatuVenezuela, RBVietnamWest Bank and GazaWorldYemen, Rep.ZambiaZimbabwe Timeline:
This timeline shows a graph from 1991 to 2016 of Europe & Central Asia (excluding high income). No data until 1990. Number of actual observations by date: 26.
Source name:
World Development Indicators
Source organization:
World Bank national accounts data, and OECD National Accounts data files.
Categories, topics:
Economy & Growth
Last updated:
apr 23, 2017
Indicators value changes by year
Minimum:
492.84 bln
jan 1, 1997
Maximum:
999.397 bln
jan 1, 2015
At the date of observation
Value
Absolute change
Change from previous value
jan 1, 1991
980.223 bln
+980.223 bln
0.0%
jan 1, 1992
913.474 bln
-66.75 bln
-6.81%
jan 1, 1993
748.63 bln
-164.844 bln
-18.05%
jan 1, 1994
664.394 bln
-84.236 bln
-11.25%
jan 1, 1995
546.108 bln
-118.286 bln
-17.8%
jan 1, 1996
526.863 bln
-19.245 bln
-3.52%
jan 1, 1997
492.84 bln
-34.022 bln
-6.46%
jan 1, 1998
508.525 bln
+15.685 bln
3.18%
jan 1, 1999
499.446 bln
-9.079 bln
-1.79%
jan 1, 2000
520.805 bln
+21.359 bln
4.28%
jan 1, 2001
574.057 bln
+53.252 bln
10.22%
jan 1, 2002
592.138 bln
+18.08 bln
3.15%
jan 1, 2003
620.363 bln
+28.225 bln
4.77%
jan 1, 2004
673.265 bln
+52.902 bln
8.53%
jan 1, 2005
741.723 bln
+68.458 bln
10.17%
jan 1, 2006
785.545 bln
+43.821 bln
5.91%
jan 1, 2007
844.24 bln
+58.695 bln
7.47%
jan 1, 2008
898.328 bln
+54.088 bln
6.41%
jan 1, 2009
912.651 bln
+14.323 bln
1.59%
jan 1, 2010
837.903 bln
-74.747 bln
-8.19%
jan 1, 2011
905.074 bln
+67.171 bln
8.02%
jan 1, 2012
950.103 bln
+45.029 bln
4.98%
jan 1, 2013
976.116 bln
+26.013 bln
2.74%
jan 1, 2014
992.0 bln
+15.884 bln
1.63%
jan 1, 2015
999.397 bln
+7.398 bln
0.75%
jan 1, 2016
990.646 bln
-8.751 bln
-0.88%
Ranking of countries by current statistics by years


Comments: