29
/
en
AIzaSyAYiBZKx7MnpbEhh9jyipgxe19OcubqV5w
April 1, 2024
235924
Senegal
SEN
true
2
1
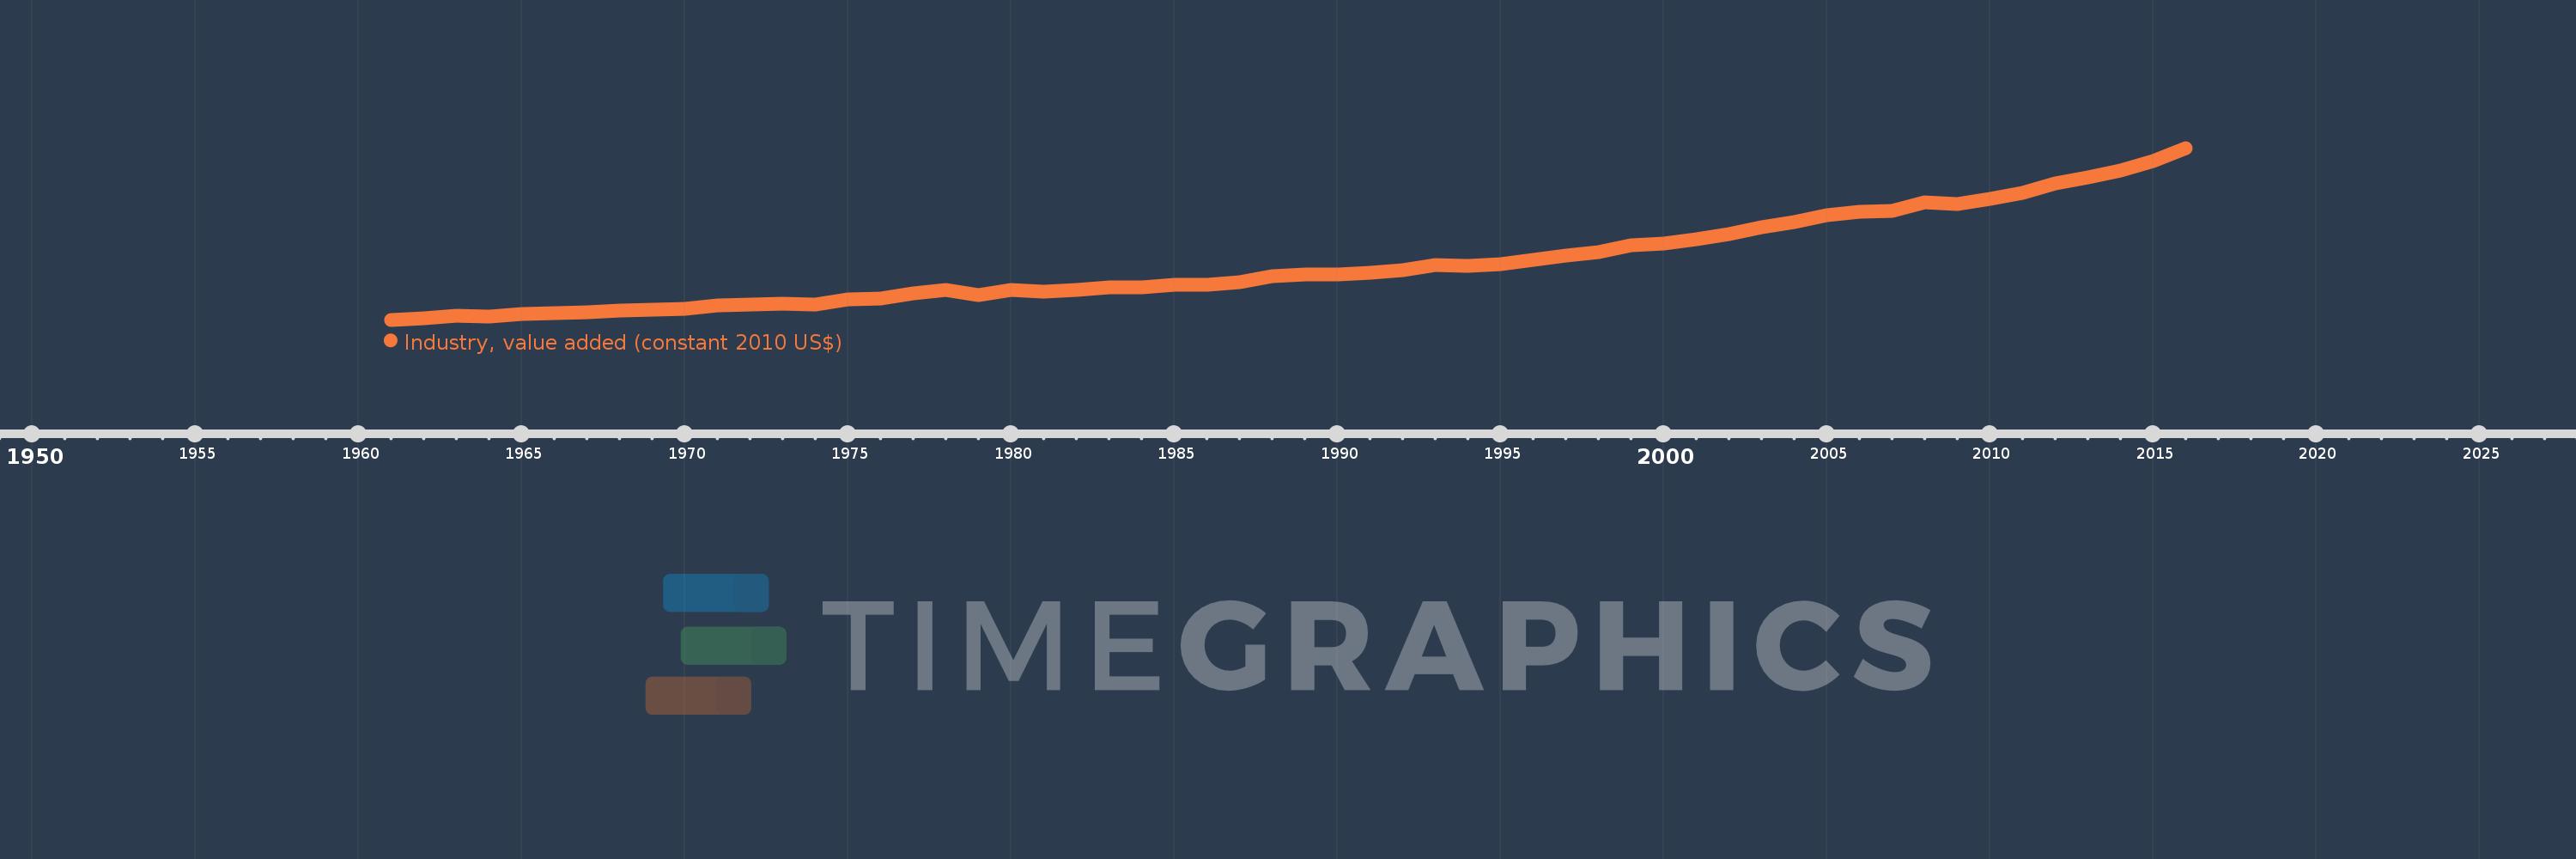
Industry, value added (constant 2010 US$)
2016,2015,2014,2013,2012,2011,2010,2009,2008,2007,2006,2005,2004,2003,2002,2001,2000,1999,1998,1997,1996,1995,1994,1993,1992,1991,1990,1989,1988,1987,1986,1985,1984,1983,1982,1981,1980,1979,1978,1977,1976,1975,1974,1973,1972,1971,1970,1969,1968,1967,1966,1965,1964,1963,1962,1961
This statistics in other country:
AfghanistanAlbaniaAlgeriaAndorraAntigua and BarbudaArab WorldArgentinaArmeniaArubaAustraliaAustriaAzerbaijanBahamas, TheBahrainBangladeshBarbadosBelarusBelgiumBelizeBeninBermudaBhutanBoliviaBosnia and HerzegovinaBotswanaBrazilBrunei DarussalamBulgariaBurkina FasoBurundiCabo VerdeCambodiaCameroonCanadaCaribbean small statesCentral African RepublicCentral Europe and the BalticsChadChileChinaColombiaComorosCongo, Dem. Rep.Congo, Rep.Costa RicaCote d'IvoireCroatiaCubaCyprusCzech RepublicDenmarkDominicaDominican RepublicEarly-demographic dividendEast Asia & PacificEast Asia & Pacific (excluding high income)East Asia & Pacific (IDA & IBRD countries)EcuadorEgypt, Arab Rep.El SalvadorEquatorial GuineaEstoniaEthiopiaEuro areaEurope & Central AsiaEurope & Central Asia (excluding high income)Europe & Central Asia (IDA & IBRD countries)European UnionFijiFinlandFragile and conflict affected situationsFranceGabonGambia, TheGeorgiaGermanyGhanaGreeceGrenadaGuatemalaGuineaGuinea-BissauGuyanaHeavily indebted poor countries (HIPC)High incomeHondurasHong Kong SAR, ChinaHungaryIBRD onlyIcelandIDA & IBRD totalIDA blendIDA onlyIDA totalIndiaIndonesiaIran, Islamic Rep.IraqIrelandItalyJamaicaJapanJordanKazakhstanKenyaKiribatiKorea, Rep.KosovoKuwaitKyrgyz RepublicLao PDRLate-demographic dividendLatin America & Caribbean Latin America & Caribbean (excluding high income)Latin America & the Caribbean (IDA & IBRD countries)LatviaLeast developed countries: UN classificationLebanonLesothoLiberiaLiechtensteinLithuaniaLow & middle incomeLow incomeLower middle incomeLuxembourgMacao SAR, ChinaMacedonia, FYRMadagascarMalawiMalaysiaMaldivesMaliMaltaMarshall IslandsMauritaniaMauritiusMexicoMicronesia, Fed. Sts.Middle East & North AfricaMiddle East & North Africa (excluding high income)Middle East & North Africa (IDA & IBRD countries)Middle incomeMoldovaMongoliaMontenegroMoroccoMozambiqueMyanmarNamibiaNepalNetherlandsNew ZealandNicaraguaNigerNigeriaNorth AmericaNorwayOECD membersOmanOther small statesPacific island small statesPakistanPalauPanamaParaguayPeruPhilippinesPolandPortugalPost-demographic dividendPre-demographic dividendPuerto RicoQatarRomaniaRussian FederationRwandaSamoaSao Tome and PrincipeSaudi ArabiaSenegalSerbiaSeychellesSierra LeoneSingaporeSlovak RepublicSloveniaSmall statesSouth AfricaSouth AsiaSouth Asia (IDA & IBRD)SpainSri LankaSt. Kitts and NevisSt. LuciaSt. Vincent and the GrenadinesSub-Saharan Africa Sub-Saharan Africa (excluding high income)Sub-Saharan Africa (IDA & IBRD countries)SudanSurinameSwazilandSwedenSwitzerlandTajikistanTanzaniaThailandTimor-LesteTogoTongaTrinidad and TobagoTunisiaTurkeyTurkmenistanTuvaluUgandaUkraineUnited Arab EmiratesUnited KingdomUnited StatesUpper middle incomeUruguayUzbekistanVanuatuVenezuela, RBVietnamWest Bank and GazaWorldYemen, Rep.ZambiaZimbabwe Timeline:
This timeline shows a graph from 1961 to 2016 of Senegal. No data until 1960. Number of actual observations by date: 56.
Source name:
World Development Indicators
Source organization:
World Bank national accounts data, and OECD National Accounts data files.
Categories, topics:
Economy & Growth
Last updated:
apr 23, 2017
Indicators value changes by year
Minimum:
462.132 mln
jan 1, 1961
Maximum:
3.402 bln
jan 1, 2016
At the date of observation
Value
Absolute change
Change from previous value
jan 1, 1961
462.132 mln
+462.132 mln
0.0%
jan 1, 1962
491.23 mln
+29.098 mln
6.3%
jan 1, 1963
526.404 mln
+35.174 mln
7.16%
jan 1, 1964
517.325 mln
-9.08 mln
-1.72%
jan 1, 1965
556.193 mln
+38.869 mln
7.51%
jan 1, 1966
575.437 mln
+19.243 mln
3.46%
jan 1, 1967
587.301 mln
+11.865 mln
2.06%
jan 1, 1968
613.727 mln
+26.426 mln
4.5%
jan 1, 1969
636.917 mln
+23.19 mln
3.78%
jan 1, 1970
651.479 mln
+14.561 mln
2.29%
jan 1, 1971
707.566 mln
+56.088 mln
8.61%
jan 1, 1972
725.363 mln
+17.797 mln
2.52%
jan 1, 1973
739.924 mln
+14.561 mln
2.01%
jan 1, 1974
725.363 mln
-14.561 mln
-1.97%
jan 1, 1975
808.416 mln
+83.053 mln
11.45%
jan 1, 1976
828.909 mln
+20.494 mln
2.54%
jan 1, 1977
918.434 mln
+89.524 mln
10.8%
jan 1, 1978
965.353 mln
+46.919 mln
5.11%
jan 1, 1979
878.525 mln
-86.828 mln
-8.99%
jan 1, 1980
975.825 mln
+97.3 mln
11.08%
jan 1, 1981
936.055 mln
-39.77 mln
-4.08%
jan 1, 1982
972.028 mln
+35.973 mln
3.84%
jan 1, 1983
1.023 bln
+50.936 mln
5.24%
jan 1, 1984
1.012 bln
-10.991 mln
-1.07%
jan 1, 1985
1.06 bln
+47.834 mln
4.73%
jan 1, 1986
1.064 bln
+4.166 mln
0.39%
jan 1, 1987
1.106 bln
+41.676 mln
3.92%
jan 1, 1988
1.214 bln
+108.325 mln
9.8%
jan 1, 1989
1.242 bln
+28.408 mln
2.34%
jan 1, 1990
1.233 bln
-9.514 mln
-0.77%
jan 1, 1991
1.266 bln
+33.217 mln
2.69%
jan 1, 1992
1.307 bln
+41.411 mln
3.27%
jan 1, 1993
1.397 bln
+89.68 mln
6.86%
jan 1, 1994
1.39 bln
-6.927 mln
-0.5%
jan 1, 1995
1.409 bln
+19.168 mln
1.38%
jan 1, 1996
1.485 bln
+75.739 mln
5.37%
jan 1, 1997
1.555 bln
+69.456 mln
4.68%
jan 1, 1998
1.615 bln
+60.032 mln
3.86%
jan 1, 1999
1.733 bln
+118.516 mln
7.34%
jan 1, 2000
1.763 bln
+29.453 mln
1.7%
jan 1, 2001
1.838 bln
+75.649 mln
4.29%
jan 1, 2002
1.93 bln
+91.964 mln
5.0%
jan 1, 2003
2.041 bln
+110.81 mln
5.74%
jan 1, 2004
2.127 bln
+85.722 mln
4.2%
jan 1, 2005
2.255 bln
+127.782 mln
6.01%
jan 1, 2006
2.31 bln
+55.561 mln
2.46%
jan 1, 2007
2.322 bln
+11.976 mln
0.52%
jan 1, 2008
2.475 bln
+152.717 mln
6.58%
jan 1, 2009
2.448 bln
-26.311 mln
-1.06%
jan 1, 2010
2.535 bln
+86.446 mln
3.53%
jan 1, 2011
2.632 bln
+97.512 mln
3.85%
jan 1, 2012
2.799 bln
+166.072 mln
6.31%
jan 1, 2013
2.899 bln
+100.904 mln
3.61%
jan 1, 2014
3.016 bln
+116.583 mln
4.02%
jan 1, 2015
3.175 bln
+159.015 mln
5.27%
jan 1, 2016
3.402 bln
+226.544 mln
7.14%
Ranking of countries by current statistics by years


Comments: