29
/
en
AIzaSyAYiBZKx7MnpbEhh9jyipgxe19OcubqV5w
April 1, 2024
190388
Mali
MLI
true
2
1
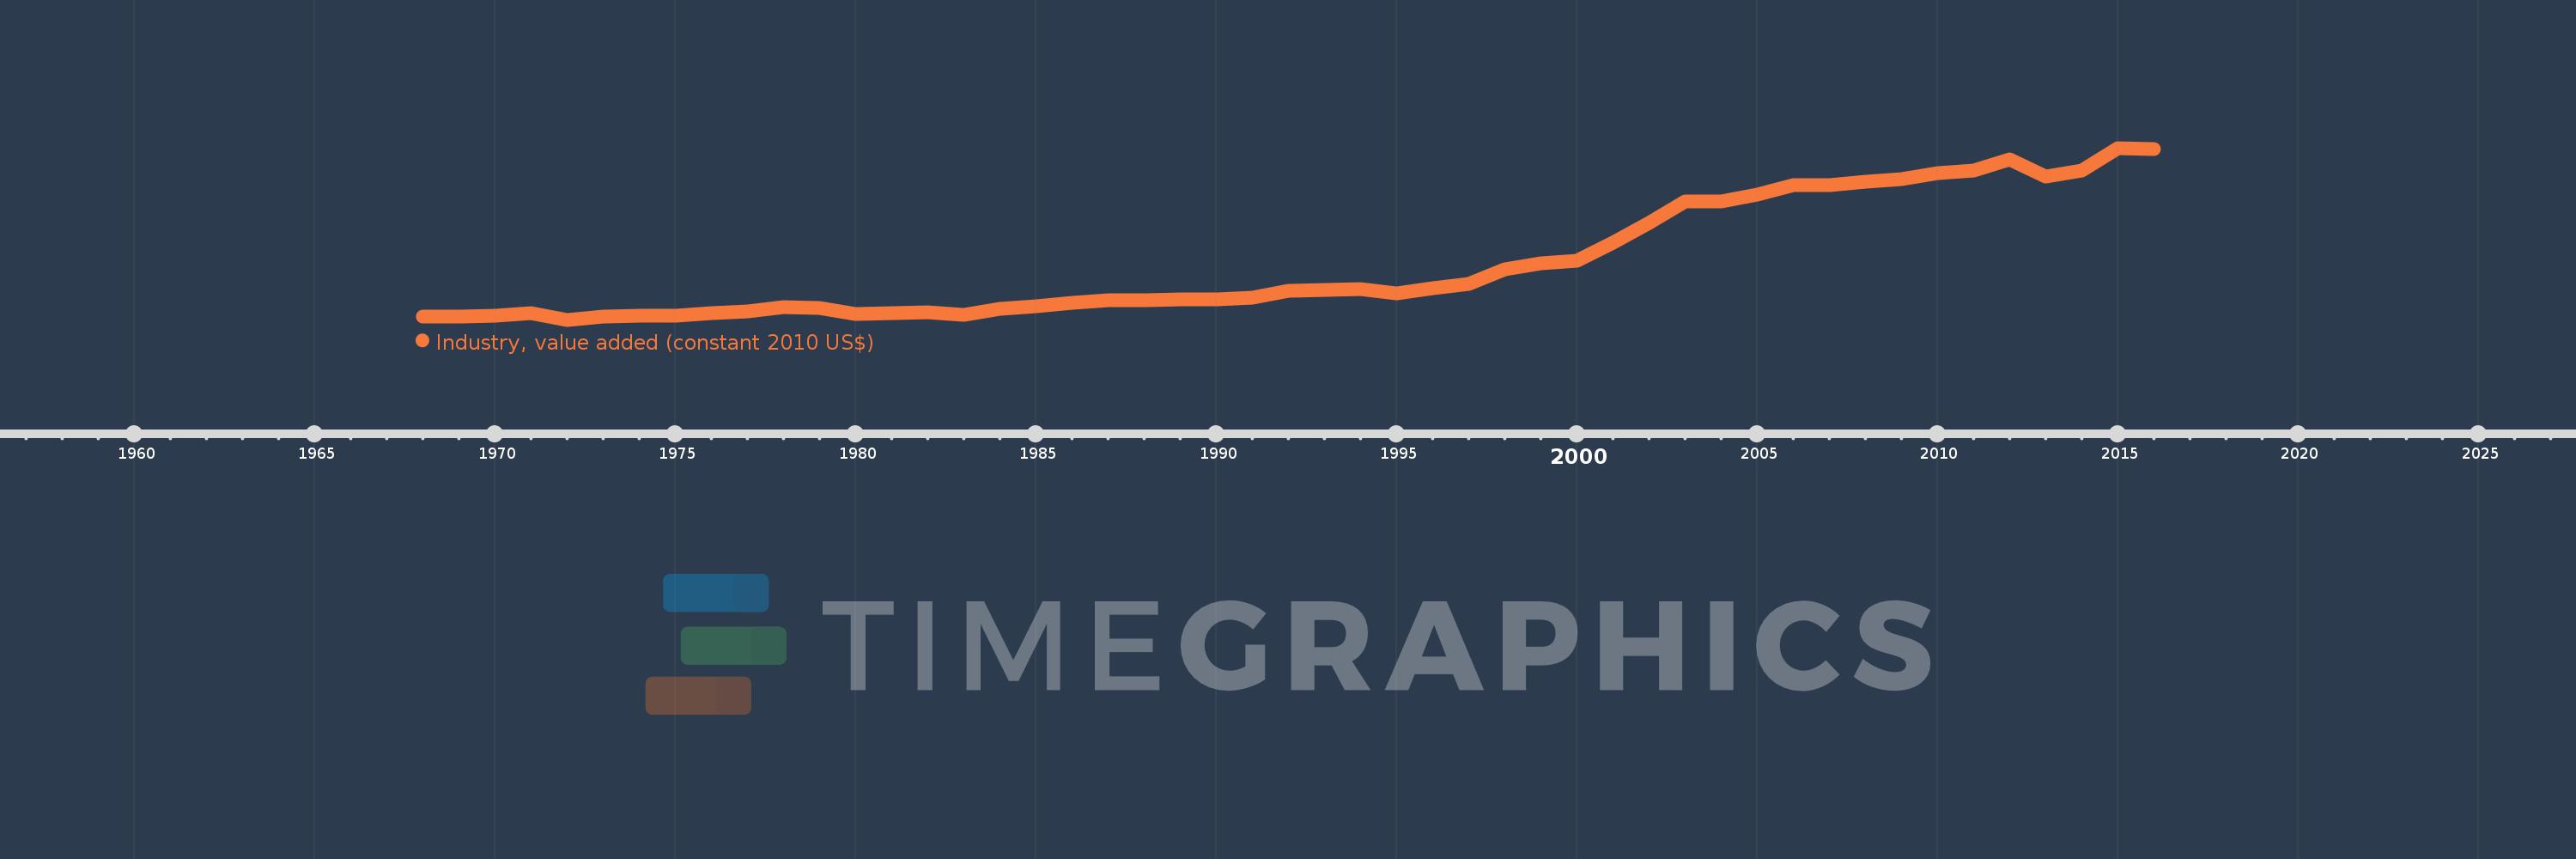
Industry, value added (constant 2010 US$)
2016,2015,2014,2013,2012,2011,2010,2009,2008,2007,2006,2005,2004,2003,2002,2001,2000,1999,1998,1997,1996,1995,1994,1993,1992,1991,1990,1989,1988,1987,1986,1985,1984,1983,1982,1981,1980,1979,1978,1977,1976,1975,1974,1973,1972,1971,1970,1969,1968
This statistics in other country:
AfghanistanAlbaniaAlgeriaAndorraAntigua and BarbudaArab WorldArgentinaArmeniaArubaAustraliaAustriaAzerbaijanBahamas, TheBahrainBangladeshBarbadosBelarusBelgiumBelizeBeninBermudaBhutanBoliviaBosnia and HerzegovinaBotswanaBrazilBrunei DarussalamBulgariaBurkina FasoBurundiCabo VerdeCambodiaCameroonCanadaCaribbean small statesCentral African RepublicCentral Europe and the BalticsChadChileChinaColombiaComorosCongo, Dem. Rep.Congo, Rep.Costa RicaCote d'IvoireCroatiaCubaCyprusCzech RepublicDenmarkDominicaDominican RepublicEarly-demographic dividendEast Asia & PacificEast Asia & Pacific (excluding high income)East Asia & Pacific (IDA & IBRD countries)EcuadorEgypt, Arab Rep.El SalvadorEquatorial GuineaEstoniaEthiopiaEuro areaEurope & Central AsiaEurope & Central Asia (excluding high income)Europe & Central Asia (IDA & IBRD countries)European UnionFijiFinlandFragile and conflict affected situationsFranceGabonGambia, TheGeorgiaGermanyGhanaGreeceGrenadaGuatemalaGuineaGuinea-BissauGuyanaHeavily indebted poor countries (HIPC)High incomeHondurasHong Kong SAR, ChinaHungaryIBRD onlyIcelandIDA & IBRD totalIDA blendIDA onlyIDA totalIndiaIndonesiaIran, Islamic Rep.IraqIrelandItalyJamaicaJapanJordanKazakhstanKenyaKiribatiKorea, Rep.KosovoKuwaitKyrgyz RepublicLao PDRLate-demographic dividendLatin America & Caribbean Latin America & Caribbean (excluding high income)Latin America & the Caribbean (IDA & IBRD countries)LatviaLeast developed countries: UN classificationLebanonLesothoLiberiaLiechtensteinLithuaniaLow & middle incomeLow incomeLower middle incomeLuxembourgMacao SAR, ChinaMacedonia, FYRMadagascarMalawiMalaysiaMaldivesMaliMaltaMarshall IslandsMauritaniaMauritiusMexicoMicronesia, Fed. Sts.Middle East & North AfricaMiddle East & North Africa (excluding high income)Middle East & North Africa (IDA & IBRD countries)Middle incomeMoldovaMongoliaMontenegroMoroccoMozambiqueMyanmarNamibiaNepalNetherlandsNew ZealandNicaraguaNigerNigeriaNorth AmericaNorwayOECD membersOmanOther small statesPacific island small statesPakistanPalauPanamaParaguayPeruPhilippinesPolandPortugalPost-demographic dividendPre-demographic dividendPuerto RicoQatarRomaniaRussian FederationRwandaSamoaSao Tome and PrincipeSaudi ArabiaSenegalSerbiaSeychellesSierra LeoneSingaporeSlovak RepublicSloveniaSmall statesSouth AfricaSouth AsiaSouth Asia (IDA & IBRD)SpainSri LankaSt. Kitts and NevisSt. LuciaSt. Vincent and the GrenadinesSub-Saharan Africa Sub-Saharan Africa (excluding high income)Sub-Saharan Africa (IDA & IBRD countries)SudanSurinameSwazilandSwedenSwitzerlandTajikistanTanzaniaThailandTimor-LesteTogoTongaTrinidad and TobagoTunisiaTurkeyTurkmenistanTuvaluUgandaUkraineUnited Arab EmiratesUnited KingdomUnited StatesUpper middle incomeUruguayUzbekistanVanuatuVenezuela, RBVietnamWest Bank and GazaWorldYemen, Rep.ZambiaZimbabwe Timeline:
This timeline shows a graph from 1968 to 2016 of Mali. No data until 1967. Number of actual observations by date: 49.
Source name:
World Development Indicators
Source organization:
World Bank national accounts data, and OECD National Accounts data files.
Categories, topics:
Economy & Growth
Last updated:
apr 23, 2017
Indicators value changes by year
Minimum:
354.412 mln
jan 1, 1972
Maximum:
2.738 bln
jan 1, 2015
At the date of observation
Value
Absolute change
Change from previous value
jan 1, 1968
395.574 mln
+395.574 mln
0.0%
jan 1, 1969
399.271 mln
+3.696 mln
0.93%
jan 1, 1970
410.367 mln
+11.096 mln
2.78%
jan 1, 1971
451.033 mln
+40.666 mln
9.91%
jan 1, 1972
354.412 mln
-96.621 mln
-21.42%
jan 1, 1973
402.622 mln
+48.21 mln
13.6%
jan 1, 1974
411.122 mln
+8.5 mln
2.11%
jan 1, 1975
411.122 mln
0.0
0.0%
jan 1, 1976
447.977 mln
+36.855 mln
8.96%
jan 1, 1977
473.498 mln
+25.522 mln
5.7%
jan 1, 1978
530.201 mln
+56.703 mln
11.98%
jan 1, 1979
521.694 mln
-8.507 mln
-1.6%
jan 1, 1980
439.472 mln
-82.221 mln
-15.76%
jan 1, 1981
444.252 mln
+4.779 mln
1.09%
jan 1, 1982
453.082 mln
+8.83 mln
1.99%
jan 1, 1983
420.318 mln
-32.764 mln
-7.23%
jan 1, 1984
502.747 mln
+82.429 mln
19.61%
jan 1, 1985
545.544 mln
+42.798 mln
8.51%
jan 1, 1986
591.064 mln
+45.52 mln
8.34%
jan 1, 1987
621.386 mln
+30.321 mln
5.13%
jan 1, 1988
629.11 mln
+7.725 mln
1.24%
jan 1, 1989
632.885 mln
+3.775 mln
0.6%
jan 1, 1990
637.072 mln
+4.186 mln
0.66%
jan 1, 1991
666.015 mln
+28.943 mln
4.54%
jan 1, 1992
753.065 mln
+87.05 mln
13.07%
jan 1, 1993
769.926 mln
+16.861 mln
2.24%
jan 1, 1994
785.039 mln
+15.113 mln
1.96%
jan 1, 1995
717.632 mln
-67.408 mln
-8.59%
jan 1, 1996
793.503 mln
+75.872 mln
10.57%
jan 1, 1997
853.175 mln
+59.671 mln
7.52%
jan 1, 1998
1.052 bln
+198.908 mln
23.31%
jan 1, 1999
1.138 bln
+85.66 mln
8.14%
jan 1, 2000
1.169 bln
+31.144 mln
2.74%
jan 1, 2001
1.419 bln
+250.17 mln
21.4%
jan 1, 2002
1.7 bln
+280.801 mln
19.79%
jan 1, 2003
1.994 bln
+294.235 mln
17.31%
jan 1, 2004
1.996 bln
+1.936 mln
0.1%
jan 1, 2005
2.096 bln
+99.48 mln
4.98%
jan 1, 2006
2.223 bln
+127.323 mln
6.08%
jan 1, 2007
2.226 bln
+3.494 mln
0.16%
jan 1, 2008
2.27 bln
+43.433 mln
1.95%
jan 1, 2009
2.305 bln
+35.547 mln
1.57%
jan 1, 2010
2.393 bln
+87.846 mln
3.81%
jan 1, 2011
2.428 bln
+34.56 mln
1.44%
jan 1, 2012
2.582 bln
+154.223 mln
6.35%
jan 1, 2013
2.34 bln
-241.886 mln
-9.37%
jan 1, 2014
2.428 bln
+87.879 mln
3.76%
jan 1, 2015
2.738 bln
+309.728 mln
12.76%
jan 1, 2016
2.722 bln
-15.614 mln
-0.57%
Ranking of countries by current statistics by years


Comments: