29
/
en
AIzaSyAYiBZKx7MnpbEhh9jyipgxe19OcubqV5w
April 1, 2024
269478
Turkey
TUR
true
2
1
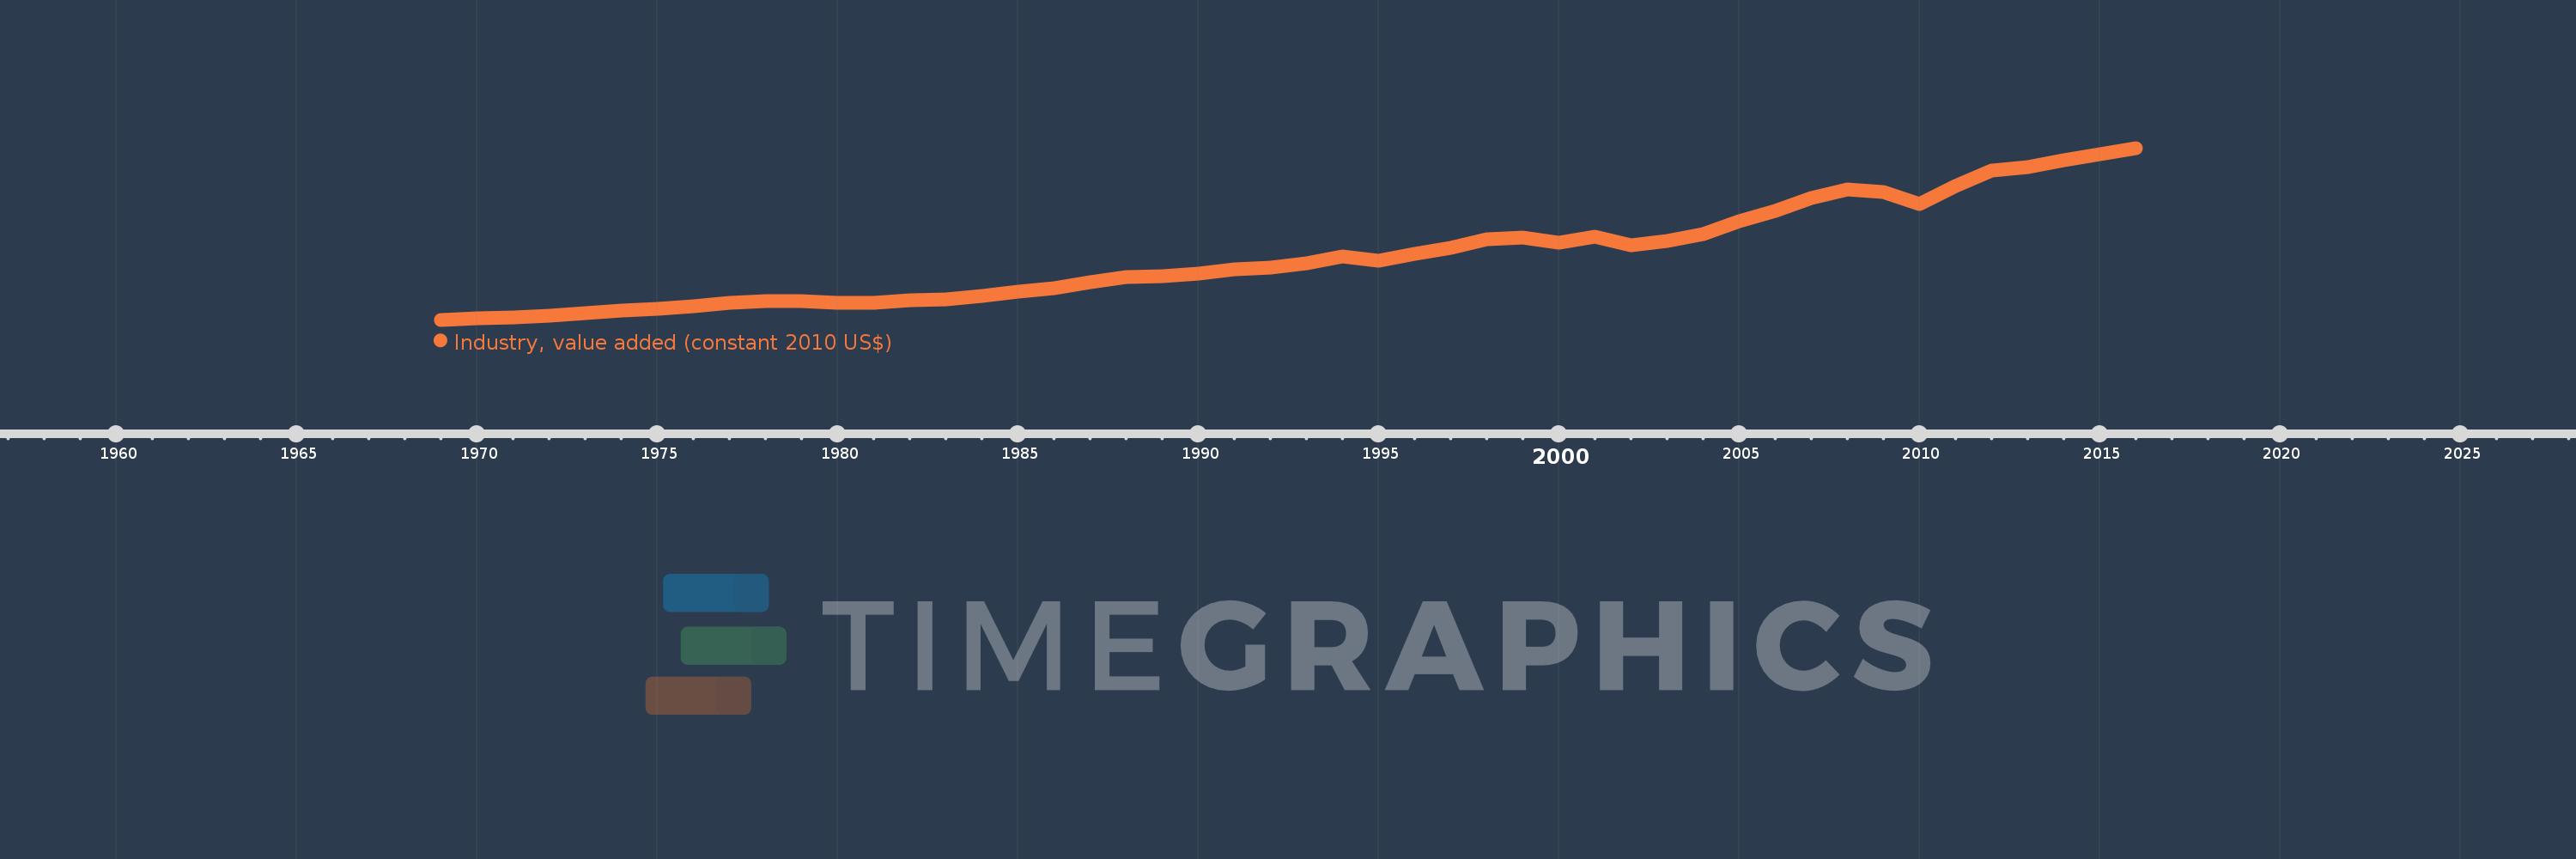
Industry, value added (constant 2010 US$)
2016,2015,2014,2013,2012,2011,2010,2009,2008,2007,2006,2005,2004,2003,2002,2001,2000,1999,1998,1997,1996,1995,1994,1993,1992,1991,1990,1989,1988,1987,1986,1985,1984,1983,1982,1981,1980,1979,1978,1977,1976,1975,1974,1973,1972,1971,1970,1969
This statistics in other country:
AfghanistanAlbaniaAlgeriaAndorraAntigua and BarbudaArab WorldArgentinaArmeniaArubaAustraliaAustriaAzerbaijanBahamas, TheBahrainBangladeshBarbadosBelarusBelgiumBelizeBeninBermudaBhutanBoliviaBosnia and HerzegovinaBotswanaBrazilBrunei DarussalamBulgariaBurkina FasoBurundiCabo VerdeCambodiaCameroonCanadaCaribbean small statesCentral African RepublicCentral Europe and the BalticsChadChileChinaColombiaComorosCongo, Dem. Rep.Congo, Rep.Costa RicaCote d'IvoireCroatiaCubaCyprusCzech RepublicDenmarkDominicaDominican RepublicEarly-demographic dividendEast Asia & PacificEast Asia & Pacific (excluding high income)East Asia & Pacific (IDA & IBRD countries)EcuadorEgypt, Arab Rep.El SalvadorEquatorial GuineaEstoniaEthiopiaEuro areaEurope & Central AsiaEurope & Central Asia (excluding high income)Europe & Central Asia (IDA & IBRD countries)European UnionFijiFinlandFragile and conflict affected situationsFranceGabonGambia, TheGeorgiaGermanyGhanaGreeceGrenadaGuatemalaGuineaGuinea-BissauGuyanaHeavily indebted poor countries (HIPC)High incomeHondurasHong Kong SAR, ChinaHungaryIBRD onlyIcelandIDA & IBRD totalIDA blendIDA onlyIDA totalIndiaIndonesiaIran, Islamic Rep.IraqIrelandItalyJamaicaJapanJordanKazakhstanKenyaKiribatiKorea, Rep.KosovoKuwaitKyrgyz RepublicLao PDRLate-demographic dividendLatin America & Caribbean Latin America & Caribbean (excluding high income)Latin America & the Caribbean (IDA & IBRD countries)LatviaLeast developed countries: UN classificationLebanonLesothoLiberiaLiechtensteinLithuaniaLow & middle incomeLow incomeLower middle incomeLuxembourgMacao SAR, ChinaMacedonia, FYRMadagascarMalawiMalaysiaMaldivesMaliMaltaMarshall IslandsMauritaniaMauritiusMexicoMicronesia, Fed. Sts.Middle East & North AfricaMiddle East & North Africa (excluding high income)Middle East & North Africa (IDA & IBRD countries)Middle incomeMoldovaMongoliaMontenegroMoroccoMozambiqueMyanmarNamibiaNepalNetherlandsNew ZealandNicaraguaNigerNigeriaNorth AmericaNorwayOECD membersOmanOther small statesPacific island small statesPakistanPalauPanamaParaguayPeruPhilippinesPolandPortugalPost-demographic dividendPre-demographic dividendPuerto RicoQatarRomaniaRussian FederationRwandaSamoaSao Tome and PrincipeSaudi ArabiaSenegalSerbiaSeychellesSierra LeoneSingaporeSlovak RepublicSloveniaSmall statesSouth AfricaSouth AsiaSouth Asia (IDA & IBRD)SpainSri LankaSt. Kitts and NevisSt. LuciaSt. Vincent and the GrenadinesSub-Saharan Africa Sub-Saharan Africa (excluding high income)Sub-Saharan Africa (IDA & IBRD countries)SudanSurinameSwazilandSwedenSwitzerlandTajikistanTanzaniaThailandTimor-LesteTogoTongaTrinidad and TobagoTunisiaTurkeyTurkmenistanTuvaluUgandaUkraineUnited Arab EmiratesUnited KingdomUnited StatesUpper middle incomeUruguayUzbekistanVanuatuVenezuela, RBVietnamWest Bank and GazaWorldYemen, Rep.ZambiaZimbabwe Timeline:
This timeline shows a graph from 1969 to 2016 of Turkey. No data until 1968. Number of actual observations by date: 48.
Source name:
World Development Indicators
Source organization:
World Bank national accounts data, and OECD National Accounts data files.
Categories, topics:
Economy & Growth
Last updated:
apr 23, 2017
Indicators value changes by year
Minimum:
22.084 bln
jan 1, 1969
Maximum:
214.334 bln
jan 1, 2016
At the date of observation
Value
Absolute change
Change from previous value
jan 1, 1969
22.084 bln
+22.084 bln
0.0%
jan 1, 1970
24.141 bln
+2.057 bln
9.32%
jan 1, 1971
25.035 bln
+893.777 mln
3.7%
jan 1, 1972
26.574 bln
+1.539 bln
6.15%
jan 1, 1973
29.356 bln
+2.782 bln
10.47%
jan 1, 1974
32.627 bln
+3.271 bln
11.14%
jan 1, 1975
34.522 bln
+1.895 bln
5.81%
jan 1, 1976
37.033 bln
+2.511 bln
7.27%
jan 1, 1977
40.665 bln
+3.632 bln
9.81%
jan 1, 1978
42.844 bln
+2.179 bln
5.36%
jan 1, 1979
42.489 bln
-355.159 mln
-0.83%
jan 1, 1980
41.029 bln
-1.46 bln
-3.44%
jan 1, 1981
40.633 bln
-396.147 mln
-0.97%
jan 1, 1982
43.736 bln
+3.103 bln
7.64%
jan 1, 1983
44.593 bln
+856.537 mln
1.96%
jan 1, 1984
48.306 bln
+3.714 bln
8.33%
jan 1, 1985
53.263 bln
+4.957 bln
10.26%
jan 1, 1986
57.371 bln
+4.108 bln
7.71%
jan 1, 1987
63.712 bln
+6.34 bln
11.05%
jan 1, 1988
70.294 bln
+6.582 bln
10.33%
jan 1, 1989
70.435 bln
+141.618 mln
0.2%
jan 1, 1990
73.912 bln
+3.477 bln
4.94%
jan 1, 1991
78.783 bln
+4.87 bln
6.59%
jan 1, 1992
80.681 bln
+1.898 bln
2.41%
jan 1, 1993
85.517 bln
+4.836 bln
5.99%
jan 1, 1994
92.479 bln
+6.962 bln
8.14%
jan 1, 1995
87.896 bln
-4.583 bln
-4.96%
jan 1, 1996
95.583 bln
+7.687 bln
8.75%
jan 1, 1997
102.178 bln
+6.596 bln
6.9%
jan 1, 1998
111.852 bln
+9.674 bln
9.47%
jan 1, 1999
113.862 bln
+2.01 bln
1.8%
jan 1, 2000
108.586 bln
-5.277 bln
-4.63%
jan 1, 2001
115.353 bln
+6.767 bln
6.23%
jan 1, 2002
104.985 bln
-10.368 bln
-8.99%
jan 1, 2003
109.934 bln
+4.949 bln
4.71%
jan 1, 2004
118.364 bln
+8.43 bln
7.67%
jan 1, 2005
132.129 bln
+13.765 bln
11.63%
jan 1, 2006
143.778 bln
+11.648 bln
8.82%
jan 1, 2007
158.501 bln
+14.723 bln
10.24%
jan 1, 2008
167.637 bln
+9.136 bln
5.76%
jan 1, 2009
165.446 bln
-2.19 bln
-1.31%
jan 1, 2010
151.211 bln
-14.236 bln
-8.6%
jan 1, 2011
172.199 bln
+20.988 bln
13.88%
jan 1, 2012
189.47 bln
+17.271 bln
10.03%
jan 1, 2013
192.499 bln
+3.03 bln
1.6%
jan 1, 2014
200.349 bln
+7.849 bln
4.08%
jan 1, 2015
207.424 bln
+7.075 bln
3.53%
jan 1, 2016
214.334 bln
+6.909 bln
3.33%
Ranking of countries by current statistics by years


Comments: