29
/
en
AIzaSyAYiBZKx7MnpbEhh9jyipgxe19OcubqV5w
April 1, 2024
87381
Bolivia
BOL
true
2
1
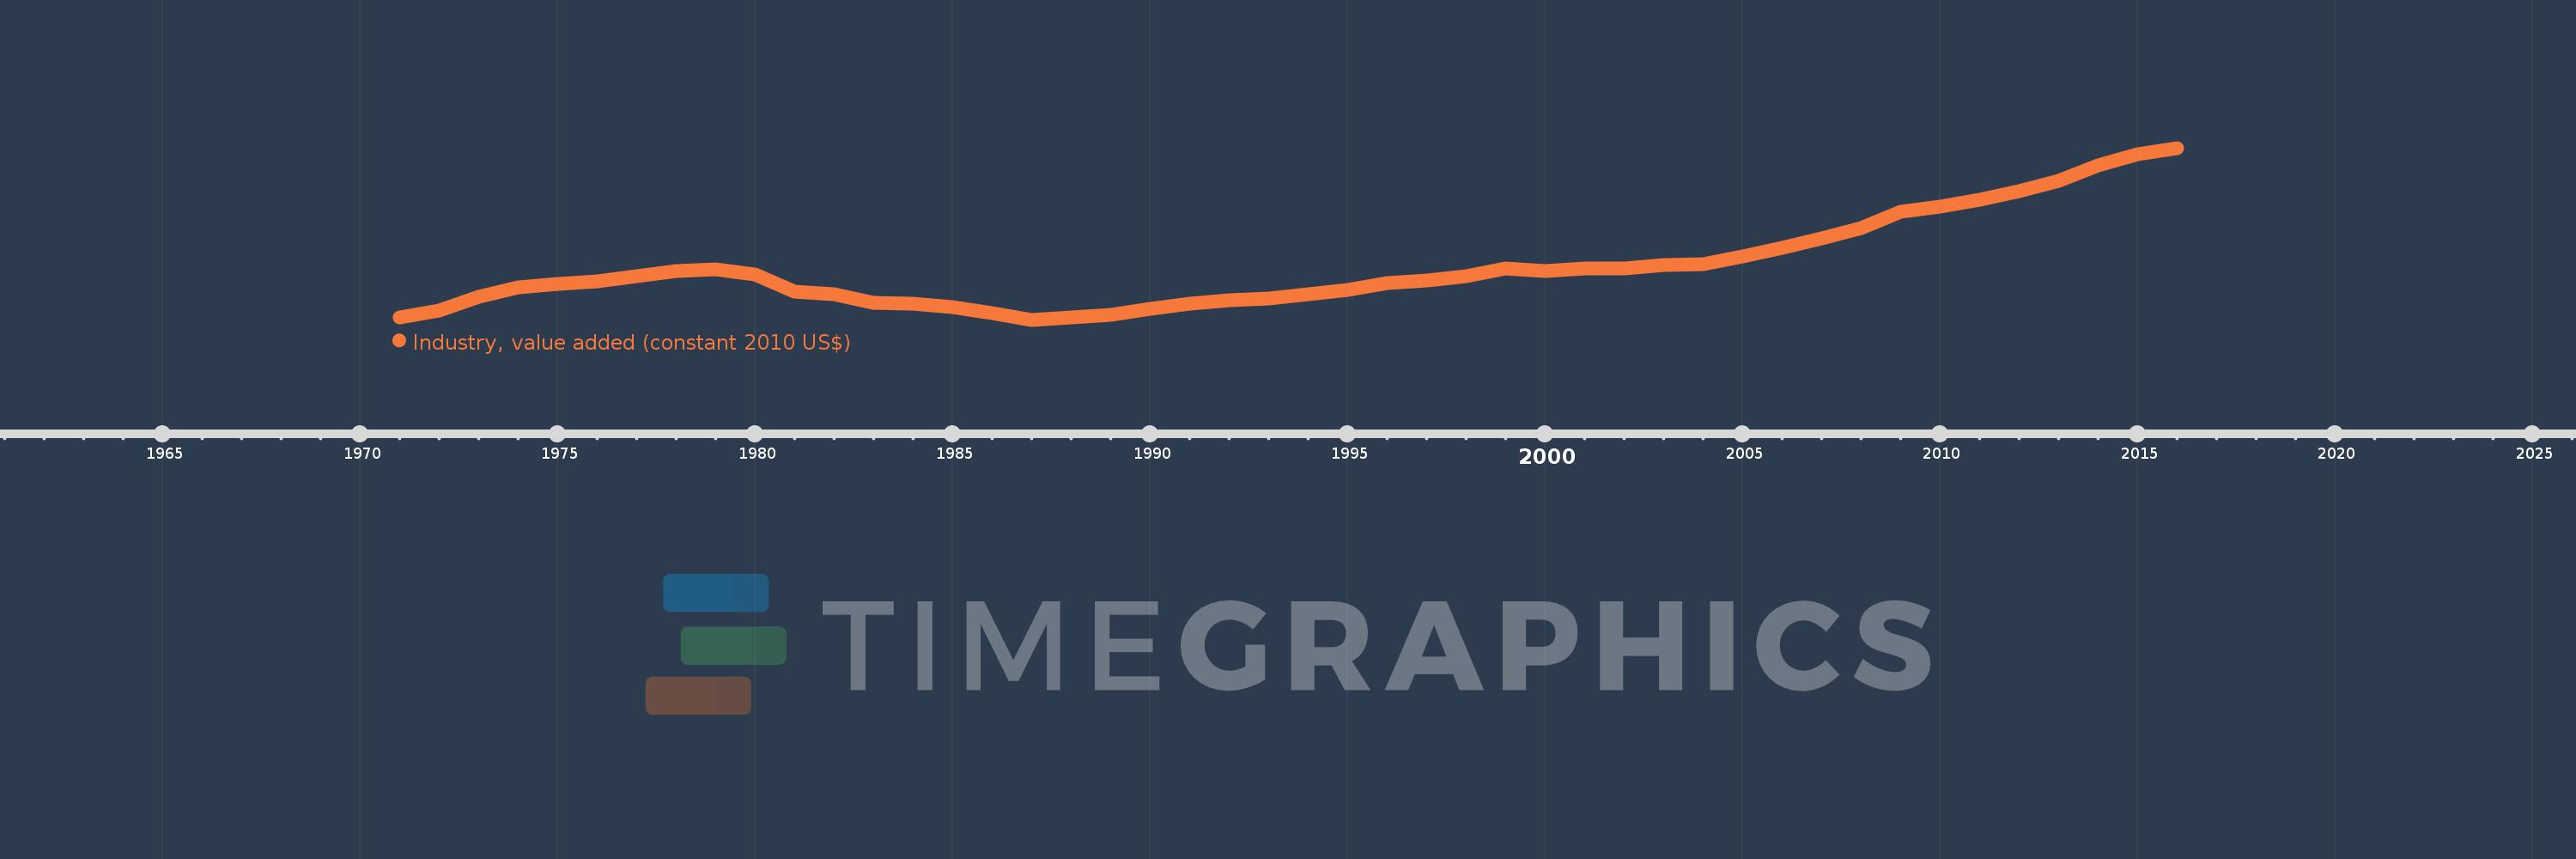
Industry, value added (constant 2010 US$)
2016,2015,2014,2013,2012,2011,2010,2009,2008,2007,2006,2005,2004,2003,2002,2001,2000,1999,1998,1997,1996,1995,1994,1993,1992,1991,1990,1989,1988,1987,1986,1985,1984,1983,1982,1981,1980,1979,1978,1977,1976,1975,1974,1973,1972,1971
This statistics in other country:
AfghanistanAlbaniaAlgeriaAndorraAntigua and BarbudaArab WorldArgentinaArmeniaArubaAustraliaAustriaAzerbaijanBahamas, TheBahrainBangladeshBarbadosBelarusBelgiumBelizeBeninBermudaBhutanBoliviaBosnia and HerzegovinaBotswanaBrazilBrunei DarussalamBulgariaBurkina FasoBurundiCabo VerdeCambodiaCameroonCanadaCaribbean small statesCentral African RepublicCentral Europe and the BalticsChadChileChinaColombiaComorosCongo, Dem. Rep.Congo, Rep.Costa RicaCote d'IvoireCroatiaCubaCyprusCzech RepublicDenmarkDominicaDominican RepublicEarly-demographic dividendEast Asia & PacificEast Asia & Pacific (excluding high income)East Asia & Pacific (IDA & IBRD countries)EcuadorEgypt, Arab Rep.El SalvadorEquatorial GuineaEstoniaEthiopiaEuro areaEurope & Central AsiaEurope & Central Asia (excluding high income)Europe & Central Asia (IDA & IBRD countries)European UnionFijiFinlandFragile and conflict affected situationsFranceGabonGambia, TheGeorgiaGermanyGhanaGreeceGrenadaGuatemalaGuineaGuinea-BissauGuyanaHeavily indebted poor countries (HIPC)High incomeHondurasHong Kong SAR, ChinaHungaryIBRD onlyIcelandIDA & IBRD totalIDA blendIDA onlyIDA totalIndiaIndonesiaIran, Islamic Rep.IraqIrelandItalyJamaicaJapanJordanKazakhstanKenyaKiribatiKorea, Rep.KosovoKuwaitKyrgyz RepublicLao PDRLate-demographic dividendLatin America & Caribbean Latin America & Caribbean (excluding high income)Latin America & the Caribbean (IDA & IBRD countries)LatviaLeast developed countries: UN classificationLebanonLesothoLiberiaLiechtensteinLithuaniaLow & middle incomeLow incomeLower middle incomeLuxembourgMacao SAR, ChinaMacedonia, FYRMadagascarMalawiMalaysiaMaldivesMaliMaltaMarshall IslandsMauritaniaMauritiusMexicoMicronesia, Fed. Sts.Middle East & North AfricaMiddle East & North Africa (excluding high income)Middle East & North Africa (IDA & IBRD countries)Middle incomeMoldovaMongoliaMontenegroMoroccoMozambiqueMyanmarNamibiaNepalNetherlandsNew ZealandNicaraguaNigerNigeriaNorth AmericaNorwayOECD membersOmanOther small statesPacific island small statesPakistanPalauPanamaParaguayPeruPhilippinesPolandPortugalPost-demographic dividendPre-demographic dividendPuerto RicoQatarRomaniaRussian FederationRwandaSamoaSao Tome and PrincipeSaudi ArabiaSenegalSerbiaSeychellesSierra LeoneSingaporeSlovak RepublicSloveniaSmall statesSouth AfricaSouth AsiaSouth Asia (IDA & IBRD)SpainSri LankaSt. Kitts and NevisSt. LuciaSt. Vincent and the GrenadinesSub-Saharan Africa Sub-Saharan Africa (excluding high income)Sub-Saharan Africa (IDA & IBRD countries)SudanSurinameSwazilandSwedenSwitzerlandTajikistanTanzaniaThailandTimor-LesteTogoTongaTrinidad and TobagoTunisiaTurkeyTurkmenistanTuvaluUgandaUkraineUnited Arab EmiratesUnited KingdomUnited StatesUpper middle incomeUruguayUzbekistanVanuatuVenezuela, RBVietnamWest Bank and GazaWorldYemen, Rep.ZambiaZimbabwe Timeline:
This timeline shows a graph from 1971 to 2016 of Bolivia. No data until 1970. Number of actual observations by date: 46.
Source name:
World Development Indicators
Source organization:
World Bank national accounts data, and OECD National Accounts data files.
Categories, topics:
Economy & Growth
Last updated:
apr 23, 2017
Indicators value changes by year
Minimum:
2.078 bln
jan 1, 1987
Maximum:
7.588 bln
jan 1, 2016
At the date of observation
Value
Absolute change
Change from previous value
jan 1, 1971
2.165 bln
+2.165 bln
0.0%
jan 1, 1972
2.361 bln
+195.985 mln
9.05%
jan 1, 1973
2.802 bln
+440.815 mln
18.67%
jan 1, 1974
3.124 bln
+322.065 mln
11.49%
jan 1, 1975
3.223 bln
+98.308 mln
3.15%
jan 1, 1976
3.315 bln
+92.654 mln
2.88%
jan 1, 1977
3.462 bln
+147.169 mln
4.44%
jan 1, 1978
3.649 bln
+186.143 mln
5.38%
jan 1, 1979
3.69 bln
+41.756 mln
1.14%
jan 1, 1980
3.532 bln
-158.468 mln
-4.29%
jan 1, 1981
2.984 bln
-547.78 mln
-15.51%
jan 1, 1982
2.885 bln
-99.169 mln
-3.32%
jan 1, 1983
2.618 bln
-266.44 mln
-9.24%
jan 1, 1984
2.588 bln
-30.262 mln
-1.16%
jan 1, 1985
2.478 bln
-110.208 mln
-4.26%
jan 1, 1986
2.297 bln
-181.222 mln
-7.31%
jan 1, 1987
2.078 bln
-218.551 mln
-9.52%
jan 1, 1988
2.153 bln
+74.869 mln
3.6%
jan 1, 1989
2.239 bln
+86.359 mln
4.01%
jan 1, 1990
2.418 bln
+179.031 mln
7.99%
jan 1, 1991
2.59 bln
+171.472 mln
7.09%
jan 1, 1992
2.699 bln
+109.137 mln
4.21%
jan 1, 1993
2.748 bln
+48.538 mln
1.8%
jan 1, 1994
2.897 bln
+149.061 mln
5.43%
jan 1, 1995
3.032 bln
+135.487 mln
4.68%
jan 1, 1996
3.244 bln
+211.876 mln
6.99%
jan 1, 1997
3.343 bln
+99.283 mln
3.06%
jan 1, 1998
3.468 bln
+124.172 mln
3.71%
jan 1, 1999
3.713 bln
+245.534 mln
7.08%
jan 1, 2000
3.64 bln
-72.823 mln
-1.96%
jan 1, 2001
3.729 bln
+88.576 mln
2.43%
jan 1, 2002
3.737 bln
+7.731 mln
0.21%
jan 1, 2003
3.837 bln
+100.103 mln
2.68%
jan 1, 2004
3.871 bln
+34.343 mln
0.9%
jan 1, 2005
4.115 bln
+243.982 mln
6.3%
jan 1, 2006
4.381 bln
+266.429 mln
6.47%
jan 1, 2007
4.685 bln
+303.818 mln
6.93%
jan 1, 2008
5.013 bln
+327.995 mln
7.0%
jan 1, 2009
5.543 bln
+530.196 mln
10.58%
jan 1, 2010
5.704 bln
+160.426 mln
2.89%
jan 1, 2011
5.923 bln
+219.337 mln
3.85%
jan 1, 2012
6.211 bln
+288.242 mln
4.87%
jan 1, 2013
6.535 bln
+323.483 mln
5.21%
jan 1, 2014
7.027 bln
+491.799 mln
7.53%
jan 1, 2015
7.395 bln
+368.192 mln
5.24%
jan 1, 2016
7.588 bln
+193.564 mln
2.62%
Ranking of countries by current statistics by years


Comments: