29
/
en
AIzaSyAYiBZKx7MnpbEhh9jyipgxe19OcubqV5w
April 1, 2024
54138
Pacific island small states
PSS
false
2
1
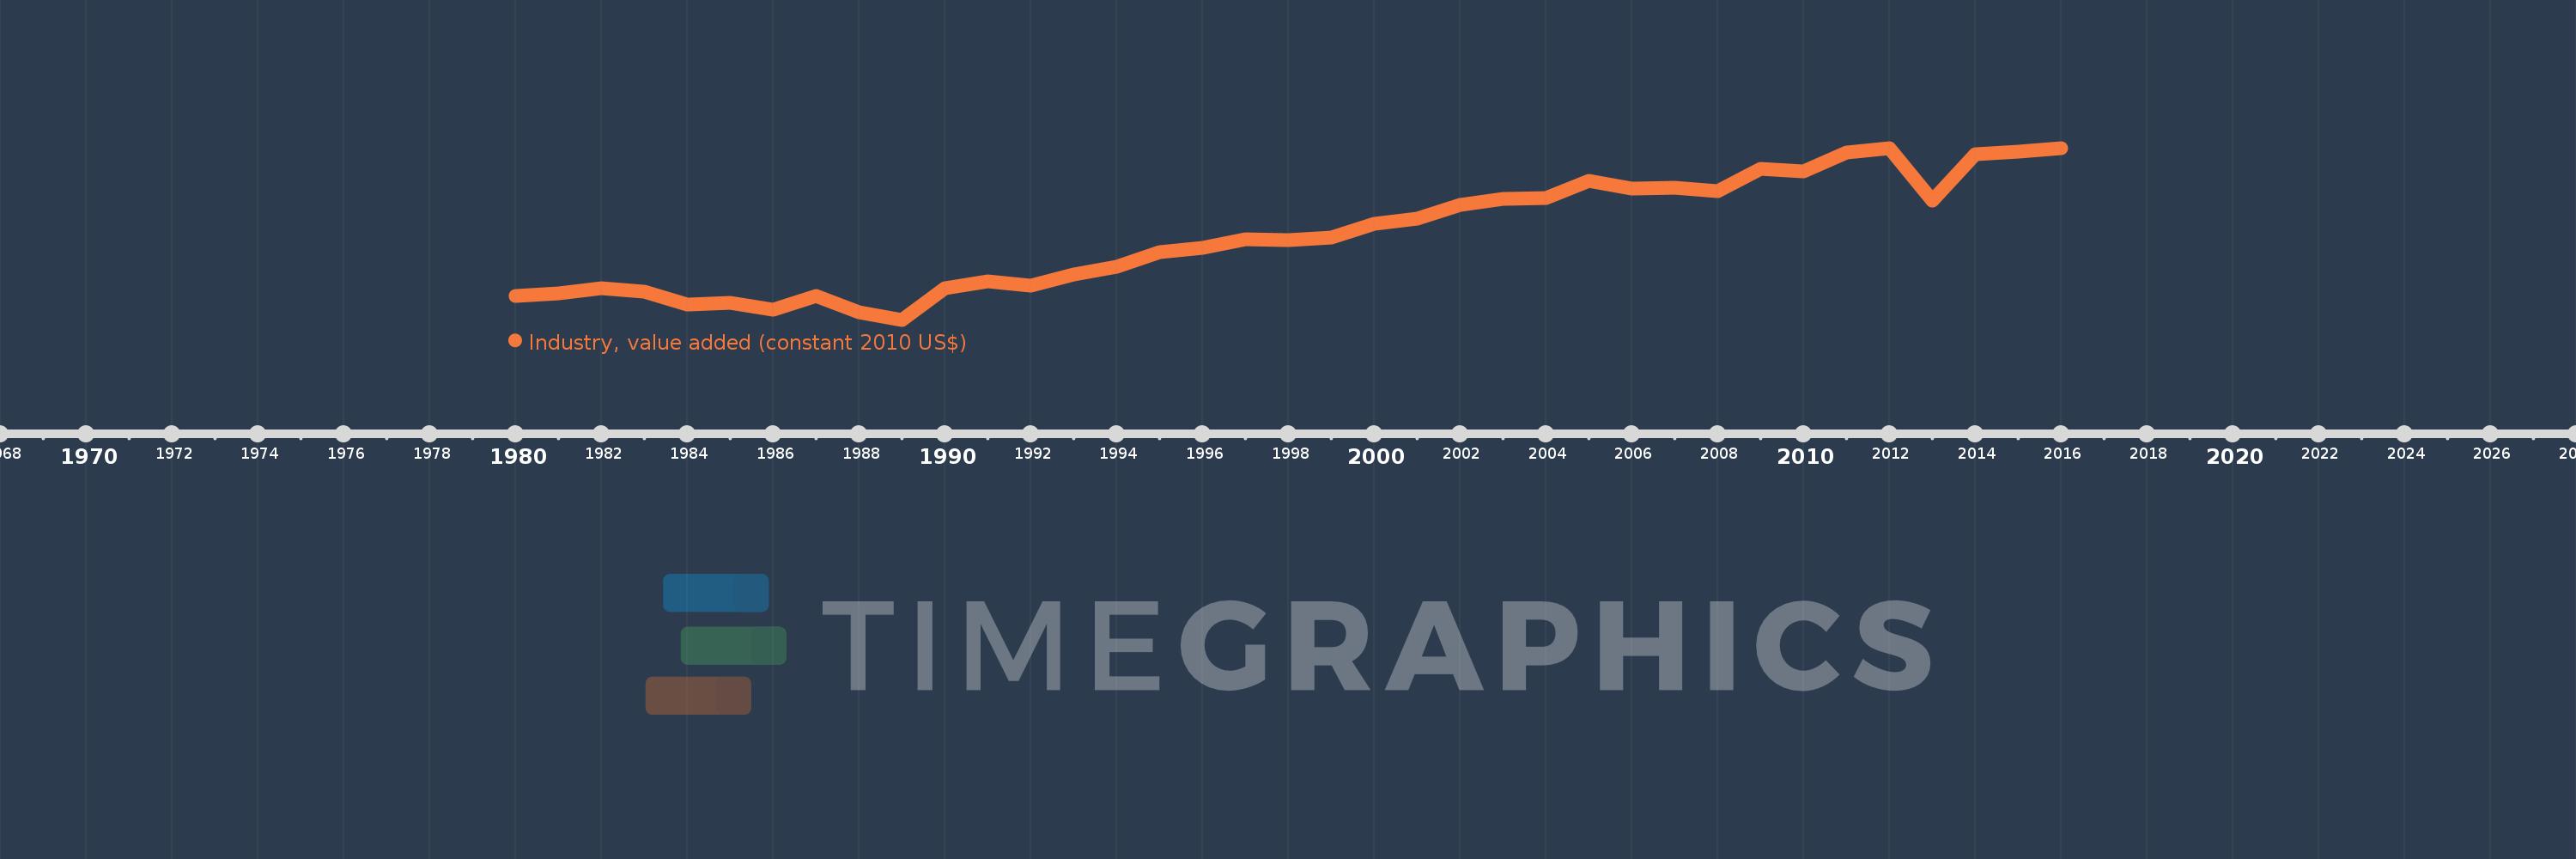
Industry, value added (constant 2010 US$)
2016,2015,2014,2013,2012,2011,2010,2009,2008,2007,2006,2005,2004,2003,2002,2001,2000,1999,1998,1997,1996,1995,1994,1993,1992,1991,1990,1989,1988,1987,1986,1985,1984,1983,1982,1981,1980
This statistics in other country:
AfghanistanAlbaniaAlgeriaAndorraAntigua and BarbudaArab WorldArgentinaArmeniaArubaAustraliaAustriaAzerbaijanBahamas, TheBahrainBangladeshBarbadosBelarusBelgiumBelizeBeninBermudaBhutanBoliviaBosnia and HerzegovinaBotswanaBrazilBrunei DarussalamBulgariaBurkina FasoBurundiCabo VerdeCambodiaCameroonCanadaCaribbean small statesCentral African RepublicCentral Europe and the BalticsChadChileChinaColombiaComorosCongo, Dem. Rep.Congo, Rep.Costa RicaCote d'IvoireCroatiaCubaCyprusCzech RepublicDenmarkDominicaDominican RepublicEarly-demographic dividendEast Asia & PacificEast Asia & Pacific (excluding high income)East Asia & Pacific (IDA & IBRD countries)EcuadorEgypt, Arab Rep.El SalvadorEquatorial GuineaEstoniaEthiopiaEuro areaEurope & Central AsiaEurope & Central Asia (excluding high income)Europe & Central Asia (IDA & IBRD countries)European UnionFijiFinlandFragile and conflict affected situationsFranceGabonGambia, TheGeorgiaGermanyGhanaGreeceGrenadaGuatemalaGuineaGuinea-BissauGuyanaHeavily indebted poor countries (HIPC)High incomeHondurasHong Kong SAR, ChinaHungaryIBRD onlyIcelandIDA & IBRD totalIDA blendIDA onlyIDA totalIndiaIndonesiaIran, Islamic Rep.IraqIrelandItalyJamaicaJapanJordanKazakhstanKenyaKiribatiKorea, Rep.KosovoKuwaitKyrgyz RepublicLao PDRLate-demographic dividendLatin America & Caribbean Latin America & Caribbean (excluding high income)Latin America & the Caribbean (IDA & IBRD countries)LatviaLeast developed countries: UN classificationLebanonLesothoLiberiaLiechtensteinLithuaniaLow & middle incomeLow incomeLower middle incomeLuxembourgMacao SAR, ChinaMacedonia, FYRMadagascarMalawiMalaysiaMaldivesMaliMaltaMarshall IslandsMauritaniaMauritiusMexicoMicronesia, Fed. Sts.Middle East & North AfricaMiddle East & North Africa (excluding high income)Middle East & North Africa (IDA & IBRD countries)Middle incomeMoldovaMongoliaMontenegroMoroccoMozambiqueMyanmarNamibiaNepalNetherlandsNew ZealandNicaraguaNigerNigeriaNorth AmericaNorwayOECD membersOmanOther small statesPacific island small statesPakistanPalauPanamaParaguayPeruPhilippinesPolandPortugalPost-demographic dividendPre-demographic dividendPuerto RicoQatarRomaniaRussian FederationRwandaSamoaSao Tome and PrincipeSaudi ArabiaSenegalSerbiaSeychellesSierra LeoneSingaporeSlovak RepublicSloveniaSmall statesSouth AfricaSouth AsiaSouth Asia (IDA & IBRD)SpainSri LankaSt. Kitts and NevisSt. LuciaSt. Vincent and the GrenadinesSub-Saharan Africa Sub-Saharan Africa (excluding high income)Sub-Saharan Africa (IDA & IBRD countries)SudanSurinameSwazilandSwedenSwitzerlandTajikistanTanzaniaThailandTimor-LesteTogoTongaTrinidad and TobagoTunisiaTurkeyTurkmenistanTuvaluUgandaUkraineUnited Arab EmiratesUnited KingdomUnited StatesUpper middle incomeUruguayUzbekistanVanuatuVenezuela, RBVietnamWest Bank and GazaWorldYemen, Rep.ZambiaZimbabwe Timeline:
This timeline shows a graph from 1980 to 2016 of Pacific island small states. No data until 1979. Number of actual observations by date: 37.
Source name:
World Development Indicators
Source organization:
World Bank national accounts data, and OECD National Accounts data files.
Categories, topics:
Economy & Growth
Last updated:
apr 23, 2017
Indicators value changes by year
Minimum:
495.957 mln
jan 1, 1989
Maximum:
1.084 bln
jan 1, 2016
At the date of observation
Value
Absolute change
Change from previous value
jan 1, 1980
578.644 mln
+578.644 mln
0.0%
jan 1, 1981
584.889 mln
+6.245 mln
1.08%
jan 1, 1982
604.13 mln
+19.241 mln
3.29%
jan 1, 1983
592.925 mln
-11.205 mln
-1.85%
jan 1, 1984
549.266 mln
-43.659 mln
-7.36%
jan 1, 1985
554.334 mln
+5.068 mln
0.92%
jan 1, 1986
529.928 mln
-24.406 mln
-4.4%
jan 1, 1987
577.84 mln
+47.913 mln
9.04%
jan 1, 1988
521.113 mln
-56.727 mln
-9.82%
jan 1, 1989
495.957 mln
-25.156 mln
-4.83%
jan 1, 1990
602.918 mln
+106.96 mln
21.57%
jan 1, 1991
626.664 mln
+23.747 mln
3.94%
jan 1, 1992
612.219 mln
-14.445 mln
-2.31%
jan 1, 1993
649.404 mln
+37.185 mln
6.07%
jan 1, 1994
678.686 mln
+29.283 mln
4.51%
jan 1, 1995
726.177 mln
+47.49 mln
7.0%
jan 1, 1996
740.548 mln
+14.372 mln
1.98%
jan 1, 1997
770.933 mln
+30.385 mln
4.1%
jan 1, 1998
768.068 mln
-2.865 mln
-0.37%
jan 1, 1999
776.804 mln
+8.736 mln
1.14%
jan 1, 2000
825.5 mln
+48.695 mln
6.27%
jan 1, 2001
840.798 mln
+15.298 mln
1.85%
jan 1, 2002
889.571 mln
+48.773 mln
5.8%
jan 1, 2003
909.881 mln
+20.31 mln
2.28%
jan 1, 2004
911.81 mln
+1.929 mln
0.21%
jan 1, 2005
971.139 mln
+59.329 mln
6.51%
jan 1, 2006
944.764 mln
-26.375 mln
-2.72%
jan 1, 2007
947.937 mln
+3.173 mln
0.34%
jan 1, 2008
936.772 mln
-11.165 mln
-1.18%
jan 1, 2009
1.013 bln
+75.838 mln
8.1%
jan 1, 2010
1.004 bln
-8.758 mln
-0.86%
jan 1, 2011
1.069 bln
+65.317 mln
6.51%
jan 1, 2012
1.083 bln
+14.287 mln
1.34%
jan 1, 2013
903.559 mln
-179.896 mln
-16.6%
jan 1, 2014
1.062 bln
+158.289 mln
17.52%
jan 1, 2015
1.071 bln
+8.702 mln
0.82%
jan 1, 2016
1.084 bln
+13.261 mln
1.24%
Ranking of countries by current statistics by years


Comments: