29
/
en
AIzaSyAYiBZKx7MnpbEhh9jyipgxe19OcubqV5w
April 1, 2024
194376
Mauritius
MUS
true
2
1
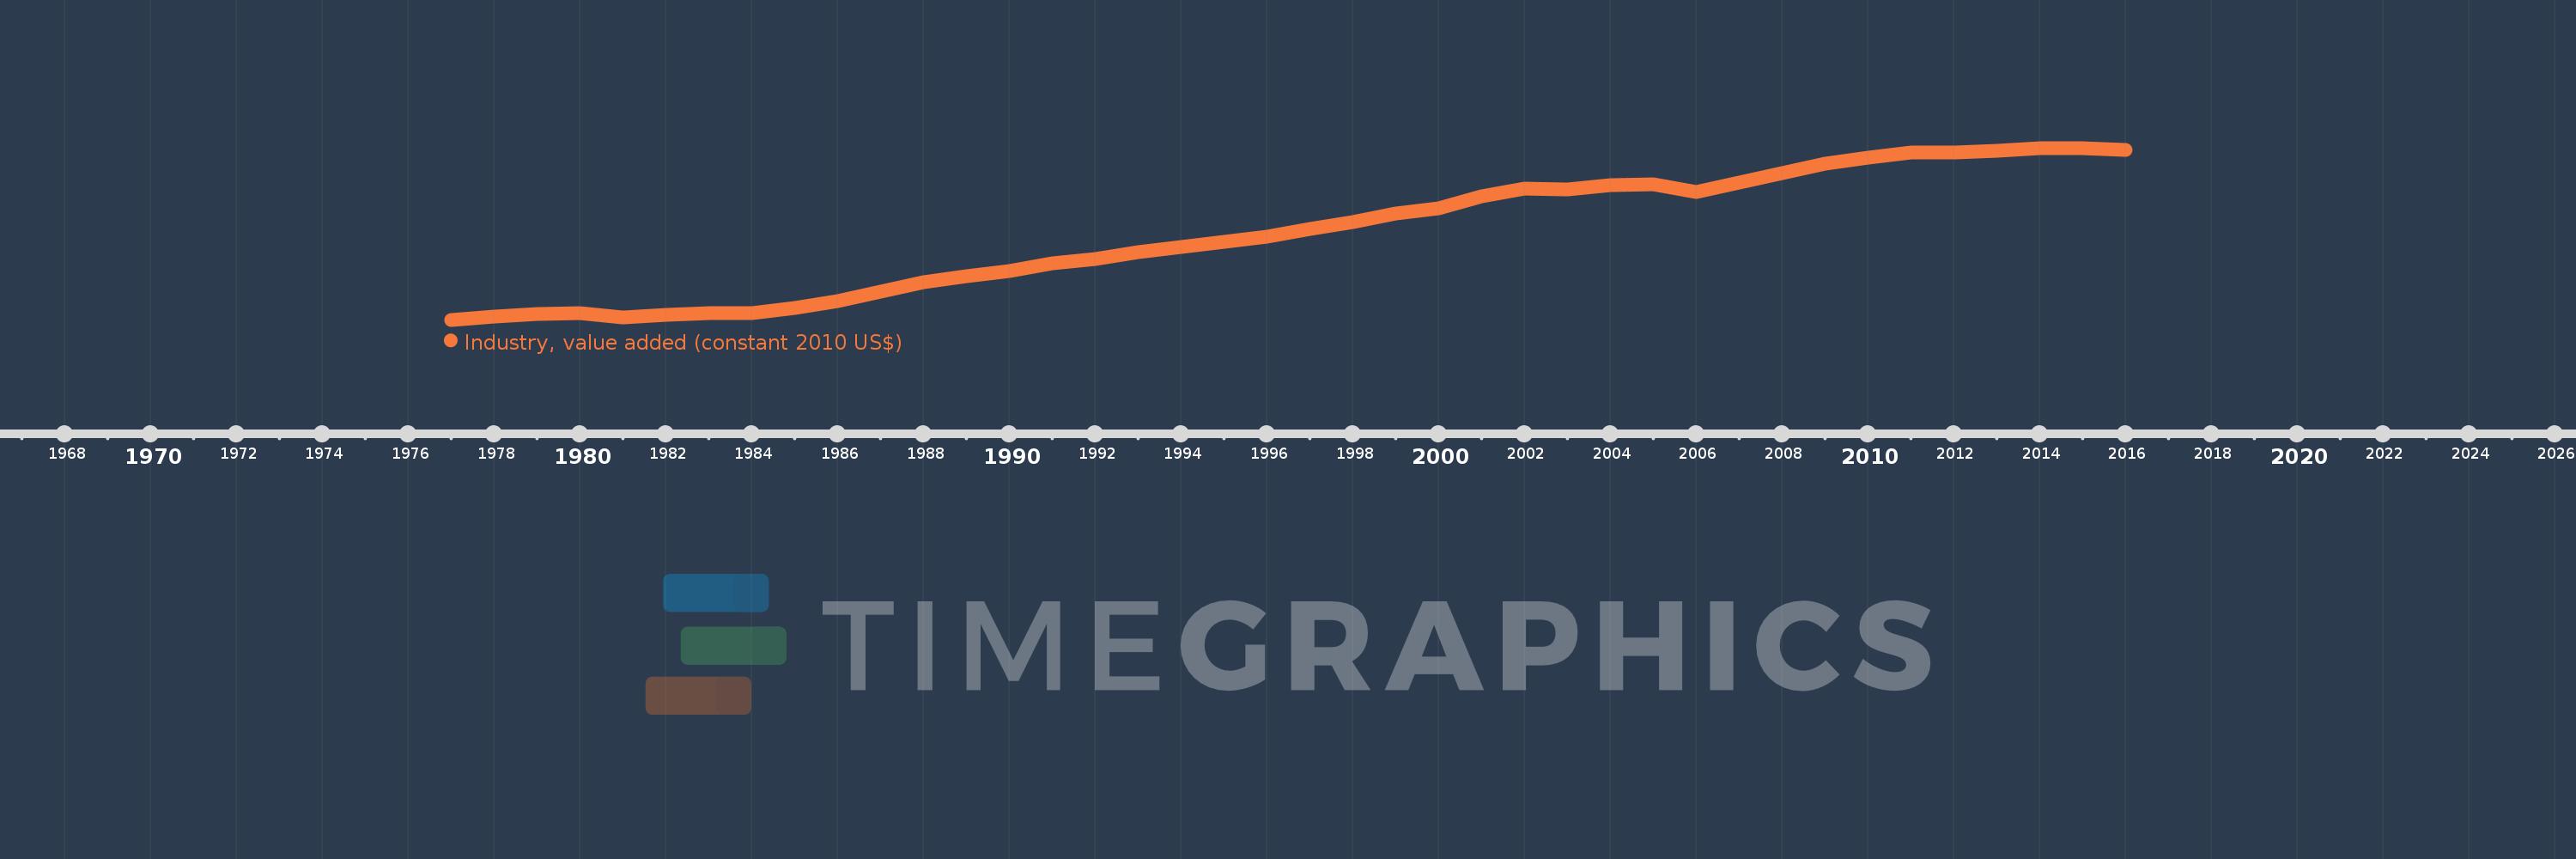
Industry, value added (constant 2010 US$)
2016,2015,2014,2013,2012,2011,2010,2009,2008,2007,2006,2005,2004,2003,2002,2001,2000,1999,1998,1997,1996,1995,1994,1993,1992,1991,1990,1989,1988,1987,1986,1985,1984,1983,1982,1981,1980,1979,1978,1977
This statistics in other country:
AfghanistanAlbaniaAlgeriaAndorraAntigua and BarbudaArab WorldArgentinaArmeniaArubaAustraliaAustriaAzerbaijanBahamas, TheBahrainBangladeshBarbadosBelarusBelgiumBelizeBeninBermudaBhutanBoliviaBosnia and HerzegovinaBotswanaBrazilBrunei DarussalamBulgariaBurkina FasoBurundiCabo VerdeCambodiaCameroonCanadaCaribbean small statesCentral African RepublicCentral Europe and the BalticsChadChileChinaColombiaComorosCongo, Dem. Rep.Congo, Rep.Costa RicaCote d'IvoireCroatiaCubaCyprusCzech RepublicDenmarkDominicaDominican RepublicEarly-demographic dividendEast Asia & PacificEast Asia & Pacific (excluding high income)East Asia & Pacific (IDA & IBRD countries)EcuadorEgypt, Arab Rep.El SalvadorEquatorial GuineaEstoniaEthiopiaEuro areaEurope & Central AsiaEurope & Central Asia (excluding high income)Europe & Central Asia (IDA & IBRD countries)European UnionFijiFinlandFragile and conflict affected situationsFranceGabonGambia, TheGeorgiaGermanyGhanaGreeceGrenadaGuatemalaGuineaGuinea-BissauGuyanaHeavily indebted poor countries (HIPC)High incomeHondurasHong Kong SAR, ChinaHungaryIBRD onlyIcelandIDA & IBRD totalIDA blendIDA onlyIDA totalIndiaIndonesiaIran, Islamic Rep.IraqIrelandItalyJamaicaJapanJordanKazakhstanKenyaKiribatiKorea, Rep.KosovoKuwaitKyrgyz RepublicLao PDRLate-demographic dividendLatin America & Caribbean Latin America & Caribbean (excluding high income)Latin America & the Caribbean (IDA & IBRD countries)LatviaLeast developed countries: UN classificationLebanonLesothoLiberiaLiechtensteinLithuaniaLow & middle incomeLow incomeLower middle incomeLuxembourgMacao SAR, ChinaMacedonia, FYRMadagascarMalawiMalaysiaMaldivesMaliMaltaMarshall IslandsMauritaniaMauritiusMexicoMicronesia, Fed. Sts.Middle East & North AfricaMiddle East & North Africa (excluding high income)Middle East & North Africa (IDA & IBRD countries)Middle incomeMoldovaMongoliaMontenegroMoroccoMozambiqueMyanmarNamibiaNepalNetherlandsNew ZealandNicaraguaNigerNigeriaNorth AmericaNorwayOECD membersOmanOther small statesPacific island small statesPakistanPalauPanamaParaguayPeruPhilippinesPolandPortugalPost-demographic dividendPre-demographic dividendPuerto RicoQatarRomaniaRussian FederationRwandaSamoaSao Tome and PrincipeSaudi ArabiaSenegalSerbiaSeychellesSierra LeoneSingaporeSlovak RepublicSloveniaSmall statesSouth AfricaSouth AsiaSouth Asia (IDA & IBRD)SpainSri LankaSt. Kitts and NevisSt. LuciaSt. Vincent and the GrenadinesSub-Saharan Africa Sub-Saharan Africa (excluding high income)Sub-Saharan Africa (IDA & IBRD countries)SudanSurinameSwazilandSwedenSwitzerlandTajikistanTanzaniaThailandTimor-LesteTogoTongaTrinidad and TobagoTunisiaTurkeyTurkmenistanTuvaluUgandaUkraineUnited Arab EmiratesUnited KingdomUnited StatesUpper middle incomeUruguayUzbekistanVanuatuVenezuela, RBVietnamWest Bank and GazaWorldYemen, Rep.ZambiaZimbabwe Timeline:
This timeline shows a graph from 1977 to 2016 of Mauritius. No data until 1976. Number of actual observations by date: 40.
Source name:
World Development Indicators
Source organization:
World Bank national accounts data, and OECD National Accounts data files.
Categories, topics:
Economy & Growth
Last updated:
apr 23, 2017
Indicators value changes by year
Minimum:
415.86 mln
jan 1, 1977
Maximum:
2.301 bln
jan 1, 2014
At the date of observation
Value
Absolute change
Change from previous value
jan 1, 1977
415.86 mln
+415.86 mln
0.0%
jan 1, 1978
449.787 mln
+33.927 mln
8.16%
jan 1, 1979
481.096 mln
+31.309 mln
6.96%
jan 1, 1980
490.176 mln
+9.08 mln
1.89%
jan 1, 1981
445.483 mln
-44.693 mln
-9.12%
jan 1, 1982
468.732 mln
+23.25 mln
5.22%
jan 1, 1983
487.557 mln
+18.825 mln
4.02%
jan 1, 1984
490.863 mln
+3.306 mln
0.68%
jan 1, 1985
540.489 mln
+49.626 mln
10.11%
jan 1, 1986
616.512 mln
+76.024 mln
14.07%
jan 1, 1987
727.001 mln
+110.489 mln
17.92%
jan 1, 1988
823.616 mln
+96.615 mln
13.29%
jan 1, 1989
897.737 mln
+74.121 mln
9.0%
jan 1, 1990
953.398 mln
+55.661 mln
6.2%
jan 1, 1991
1.032 bln
+78.888 mln
8.27%
jan 1, 1992
1.086 bln
+54.11 mln
5.24%
jan 1, 1993
1.162 bln
+75.78 mln
6.98%
jan 1, 1994
1.216 bln
+54.08 mln
4.65%
jan 1, 1995
1.272 bln
+55.793 mln
4.59%
jan 1, 1996
1.331 bln
+58.684 mln
4.61%
jan 1, 1997
1.413 bln
+82.732 mln
6.22%
jan 1, 1998
1.483 bln
+69.568 mln
4.92%
jan 1, 1999
1.582 bln
+98.605 mln
6.65%
jan 1, 2000
1.637 bln
+55.173 mln
3.49%
jan 1, 2001
1.773 bln
+136.231 mln
8.32%
jan 1, 2002
1.86 bln
+86.504 mln
4.88%
jan 1, 2003
1.844 bln
-15.671 mln
-0.84%
jan 1, 2004
1.888 bln
+43.998 mln
2.39%
jan 1, 2005
1.902 bln
+13.734 mln
0.73%
jan 1, 2006
1.813 bln
-89.033 mln
-4.68%
jan 1, 2007
1.924 bln
+111.628 mln
6.16%
jan 1, 2008
2.024 bln
+99.653 mln
5.18%
jan 1, 2009
2.126 bln
+102.619 mln
5.07%
jan 1, 2010
2.19 bln
+63.721 mln
3.0%
jan 1, 2011
2.248 bln
+57.827 mln
2.64%
jan 1, 2012
2.248 bln
-6.554K
0.0%
jan 1, 2013
2.267 bln
+18.671 mln
0.83%
jan 1, 2014
2.301 bln
+33.909 mln
1.5%
jan 1, 2015
2.293 bln
-7.383 mln
-0.32%
jan 1, 2016
2.277 bln
-16.497 mln
-0.72%
Ranking of countries by current statistics by years


Comments: