29
/
en
AIzaSyAYiBZKx7MnpbEhh9jyipgxe19OcubqV5w
April 1, 2024
28226
East Asia & Pacific (excluding high income)
EAP
false
2
1
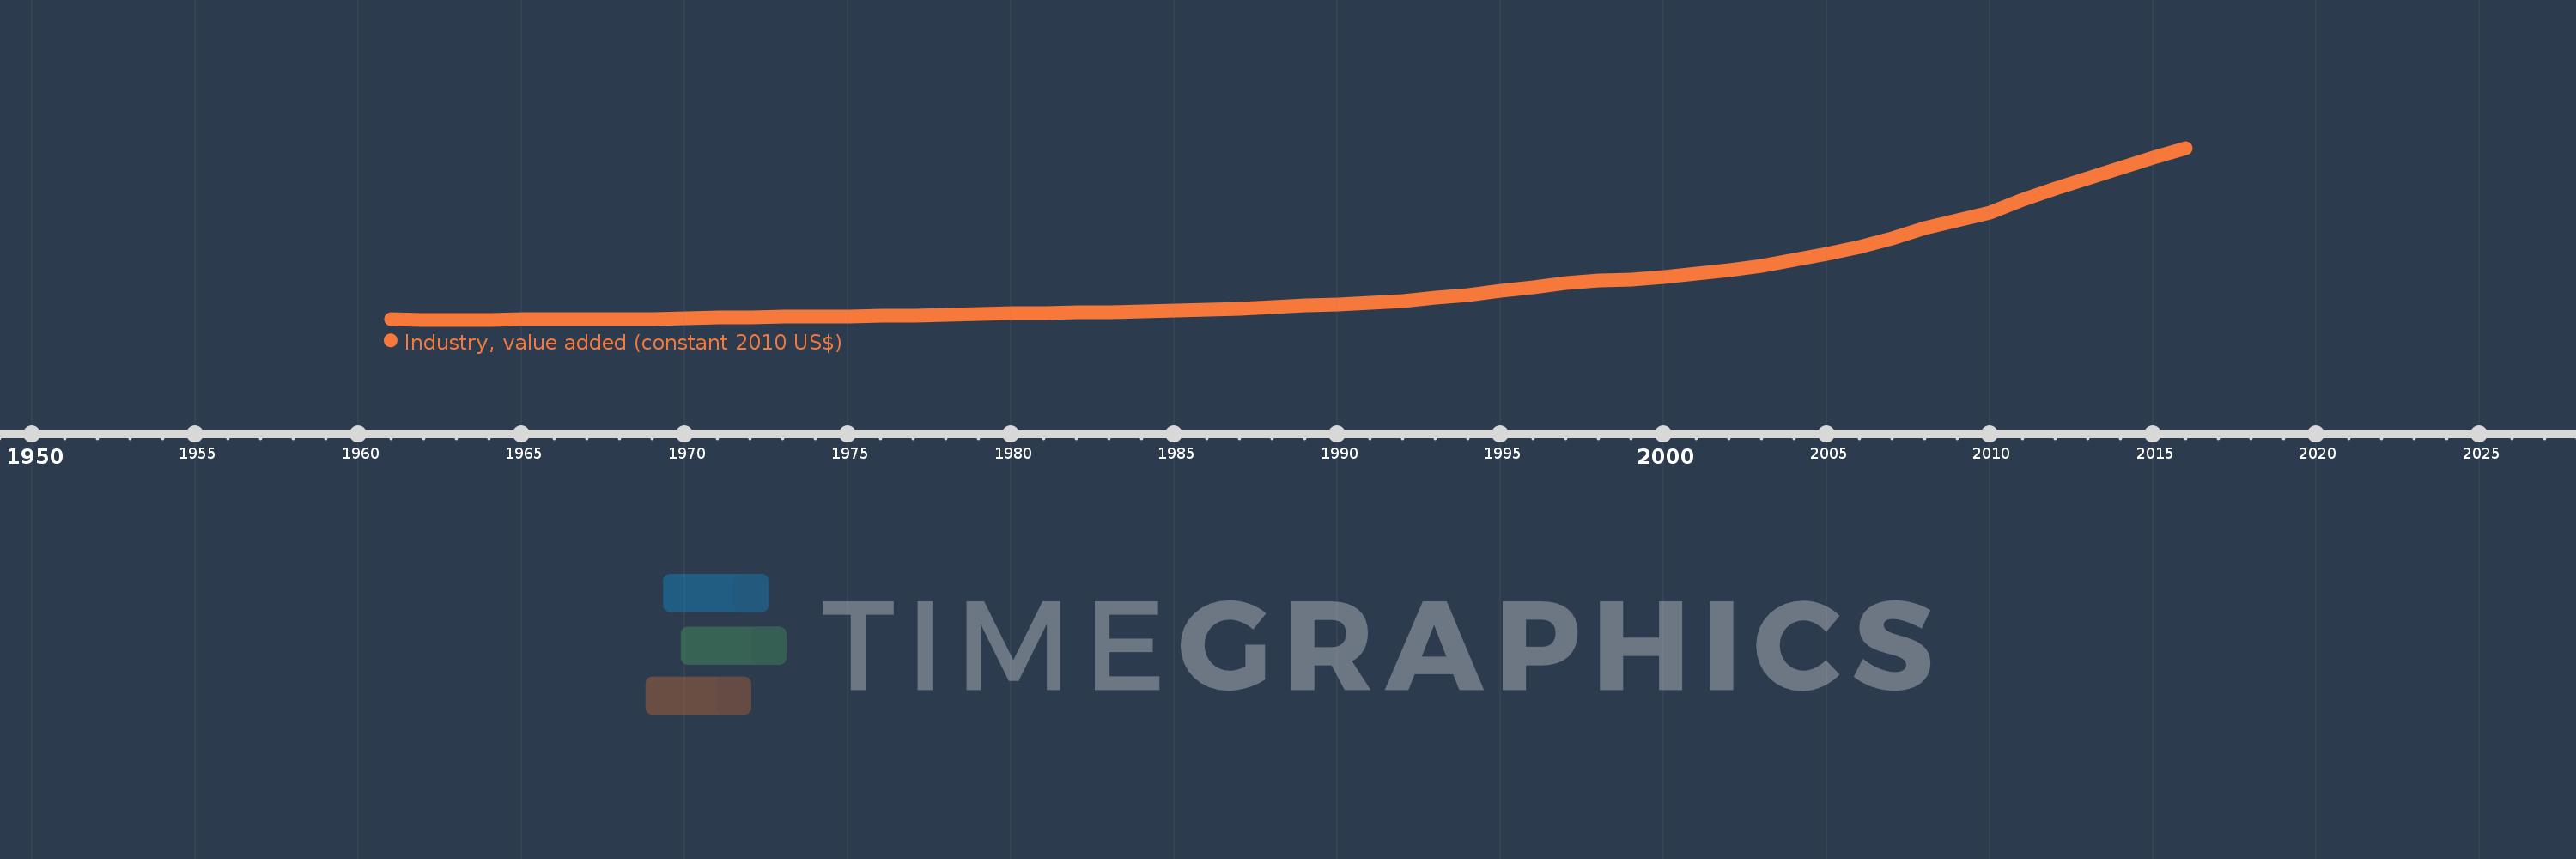
Industry, value added (constant 2010 US$)
2016,2015,2014,2013,2012,2011,2010,2009,2008,2007,2006,2005,2004,2003,2002,2001,2000,1999,1998,1997,1996,1995,1994,1993,1992,1991,1990,1989,1988,1987,1986,1985,1984,1983,1982,1981,1980,1979,1978,1977,1976,1975,1974,1973,1972,1971,1970,1969,1968,1967,1966,1965,1964,1963,1962,1961
This statistics in other country:
AfghanistanAlbaniaAlgeriaAndorraAntigua and BarbudaArab WorldArgentinaArmeniaArubaAustraliaAustriaAzerbaijanBahamas, TheBahrainBangladeshBarbadosBelarusBelgiumBelizeBeninBermudaBhutanBoliviaBosnia and HerzegovinaBotswanaBrazilBrunei DarussalamBulgariaBurkina FasoBurundiCabo VerdeCambodiaCameroonCanadaCaribbean small statesCentral African RepublicCentral Europe and the BalticsChadChileChinaColombiaComorosCongo, Dem. Rep.Congo, Rep.Costa RicaCote d'IvoireCroatiaCubaCyprusCzech RepublicDenmarkDominicaDominican RepublicEarly-demographic dividendEast Asia & PacificEast Asia & Pacific (excluding high income)East Asia & Pacific (IDA & IBRD countries)EcuadorEgypt, Arab Rep.El SalvadorEquatorial GuineaEstoniaEthiopiaEuro areaEurope & Central AsiaEurope & Central Asia (excluding high income)Europe & Central Asia (IDA & IBRD countries)European UnionFijiFinlandFragile and conflict affected situationsFranceGabonGambia, TheGeorgiaGermanyGhanaGreeceGrenadaGuatemalaGuineaGuinea-BissauGuyanaHeavily indebted poor countries (HIPC)High incomeHondurasHong Kong SAR, ChinaHungaryIBRD onlyIcelandIDA & IBRD totalIDA blendIDA onlyIDA totalIndiaIndonesiaIran, Islamic Rep.IraqIrelandItalyJamaicaJapanJordanKazakhstanKenyaKiribatiKorea, Rep.KosovoKuwaitKyrgyz RepublicLao PDRLate-demographic dividendLatin America & Caribbean Latin America & Caribbean (excluding high income)Latin America & the Caribbean (IDA & IBRD countries)LatviaLeast developed countries: UN classificationLebanonLesothoLiberiaLiechtensteinLithuaniaLow & middle incomeLow incomeLower middle incomeLuxembourgMacao SAR, ChinaMacedonia, FYRMadagascarMalawiMalaysiaMaldivesMaliMaltaMarshall IslandsMauritaniaMauritiusMexicoMicronesia, Fed. Sts.Middle East & North AfricaMiddle East & North Africa (excluding high income)Middle East & North Africa (IDA & IBRD countries)Middle incomeMoldovaMongoliaMontenegroMoroccoMozambiqueMyanmarNamibiaNepalNetherlandsNew ZealandNicaraguaNigerNigeriaNorth AmericaNorwayOECD membersOmanOther small statesPacific island small statesPakistanPalauPanamaParaguayPeruPhilippinesPolandPortugalPost-demographic dividendPre-demographic dividendPuerto RicoQatarRomaniaRussian FederationRwandaSamoaSao Tome and PrincipeSaudi ArabiaSenegalSerbiaSeychellesSierra LeoneSingaporeSlovak RepublicSloveniaSmall statesSouth AfricaSouth AsiaSouth Asia (IDA & IBRD)SpainSri LankaSt. Kitts and NevisSt. LuciaSt. Vincent and the GrenadinesSub-Saharan Africa Sub-Saharan Africa (excluding high income)Sub-Saharan Africa (IDA & IBRD countries)SudanSurinameSwazilandSwedenSwitzerlandTajikistanTanzaniaThailandTimor-LesteTogoTongaTrinidad and TobagoTunisiaTurkeyTurkmenistanTuvaluUgandaUkraineUnited Arab EmiratesUnited KingdomUnited StatesUpper middle incomeUruguayUzbekistanVanuatuVenezuela, RBVietnamWest Bank and GazaWorldYemen, Rep.ZambiaZimbabwe Timeline:
This timeline shows a graph from 1961 to 2016 of East Asia & Pacific (excluding high income). No data until 1960. Number of actual observations by date: 56.
Source name:
World Development Indicators
Source organization:
World Bank national accounts data, and OECD National Accounts data files.
Categories, topics:
Economy & Growth
Last updated:
apr 23, 2017
Indicators value changes by year
Minimum:
46.633 bln
jan 1, 1963
Maximum:
5.049 trl
jan 1, 2016
At the date of observation
Value
Absolute change
Change from previous value
jan 1, 1961
59.841 bln
+59.841 bln
0.0%
jan 1, 1962
47.508 bln
-12.333 bln
-20.61%
jan 1, 1963
46.633 bln
-874.351 mln
-1.84%
jan 1, 1964
49.843 bln
+3.21 bln
6.88%
jan 1, 1965
56.281 bln
+6.438 bln
12.92%
jan 1, 1966
63.959 bln
+7.679 bln
13.64%
jan 1, 1967
72.221 bln
+8.261 bln
12.92%
jan 1, 1968
69.528 bln
-2.692 bln
-3.73%
jan 1, 1969
71.751 bln
+2.223 bln
3.2%
jan 1, 1970
86.709 bln
+14.958 bln
20.85%
jan 1, 1971
105.701 bln
+18.992 bln
21.9%
jan 1, 1972
115.397 bln
+9.696 bln
9.17%
jan 1, 1973
127.166 bln
+11.769 bln
10.2%
jan 1, 1974
142.174 bln
+15.007 bln
11.8%
jan 1, 1975
148.034 bln
+5.86 bln
4.12%
jan 1, 1976
161.174 bln
+13.14 bln
8.88%
jan 1, 1977
171.36 bln
+10.186 bln
6.32%
jan 1, 1978
191.72 bln
+20.36 bln
11.88%
jan 1, 1979
211.19 bln
+19.47 bln
10.16%
jan 1, 1980
227.801 bln
+16.611 bln
7.87%
jan 1, 1981
250.015 bln
+22.214 bln
9.75%
jan 1, 1982
259.097 bln
+9.081 bln
3.63%
jan 1, 1983
265.008 bln
+5.912 bln
2.28%
jan 1, 1984
293.141 bln
+28.133 bln
10.62%
jan 1, 1985
321.282 bln
+28.141 bln
9.6%
jan 1, 1986
345.24 bln
+23.958 bln
7.46%
jan 1, 1987
373.702 bln
+28.462 bln
8.24%
jan 1, 1988
412.17 bln
+38.468 bln
10.29%
jan 1, 1989
461.671 bln
+49.501 bln
12.01%
jan 1, 1990
496.585 bln
+34.914 bln
7.56%
jan 1, 1991
526.961 bln
+30.376 bln
6.12%
jan 1, 1992
585.806 bln
+58.845 bln
11.17%
jan 1, 1993
684.292 bln
+98.487 bln
16.81%
jan 1, 1994
768.679 bln
+84.387 bln
12.33%
jan 1, 1995
882.234 bln
+113.554 bln
14.77%
jan 1, 1996
994.601 bln
+112.367 bln
12.74%
jan 1, 1997
1.106 trl
+111.102 bln
11.17%
jan 1, 1998
1.193 trl
+87.247 bln
7.89%
jan 1, 1999
1.211 trl
+17.726 bln
1.49%
jan 1, 2000
1.292 trl
+81.447 bln
6.73%
jan 1, 2001
1.402 trl
+109.553 bln
8.48%
jan 1, 2002
1.491 trl
+89.77 bln
6.4%
jan 1, 2003
1.618 trl
+126.074 bln
8.45%
jan 1, 2004
1.79 trl
+172.078 bln
10.64%
jan 1, 2005
1.961 trl
+171.776 bln
9.6%
jan 1, 2006
2.16 trl
+198.759 bln
10.13%
jan 1, 2007
2.403 trl
+243.193 bln
11.26%
jan 1, 2008
2.705 trl
+301.354 bln
12.54%
jan 1, 2009
2.928 trl
+223.751 bln
8.27%
jan 1, 2010
3.168 trl
+239.964 bln
8.19%
jan 1, 2011
3.528 trl
+359.991 bln
11.36%
jan 1, 2012
3.856 trl
+327.886 bln
9.29%
jan 1, 2013
4.162 trl
+306.021 bln
7.94%
jan 1, 2014
4.468 trl
+305.902 bln
7.35%
jan 1, 2015
4.775 trl
+307.021 bln
6.87%
jan 1, 2016
5.049 trl
+273.553 bln
5.73%
Ranking of countries by current statistics by years


Comments: