29
/
en
AIzaSyAYiBZKx7MnpbEhh9jyipgxe19OcubqV5w
April 1, 2024
111084
Congo, Rep.
COG
true
2
1
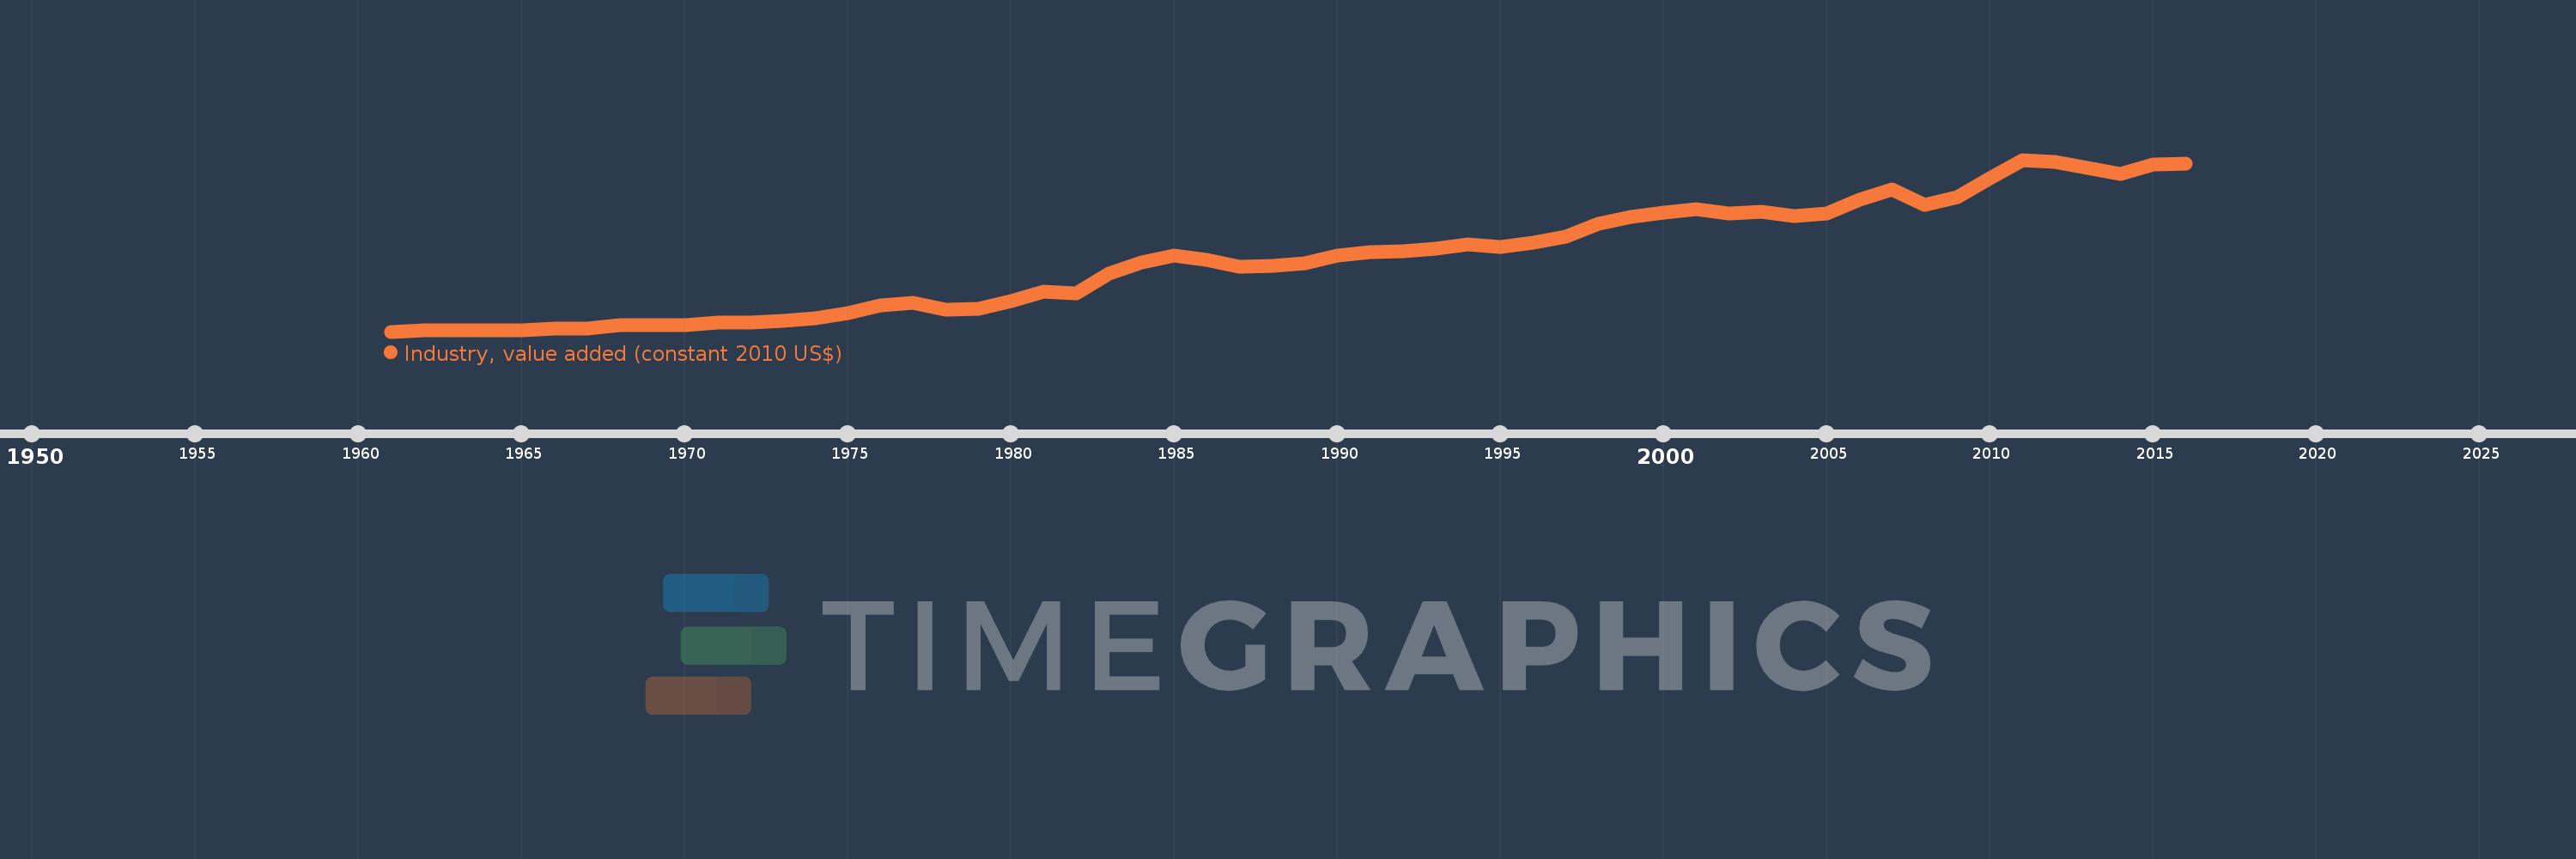
Industry, value added (constant 2010 US$)
2016,2015,2014,2013,2012,2011,2010,2009,2008,2007,2006,2005,2004,2003,2002,2001,2000,1999,1998,1997,1996,1995,1994,1993,1992,1991,1990,1989,1988,1987,1986,1985,1984,1983,1982,1981,1980,1979,1978,1977,1976,1975,1974,1973,1972,1971,1970,1969,1968,1967,1966,1965,1964,1963,1962,1961
This statistics in other country:
AfghanistanAlbaniaAlgeriaAndorraAntigua and BarbudaArab WorldArgentinaArmeniaArubaAustraliaAustriaAzerbaijanBahamas, TheBahrainBangladeshBarbadosBelarusBelgiumBelizeBeninBermudaBhutanBoliviaBosnia and HerzegovinaBotswanaBrazilBrunei DarussalamBulgariaBurkina FasoBurundiCabo VerdeCambodiaCameroonCanadaCaribbean small statesCentral African RepublicCentral Europe and the BalticsChadChileChinaColombiaComorosCongo, Dem. Rep.Congo, Rep.Costa RicaCote d'IvoireCroatiaCubaCyprusCzech RepublicDenmarkDominicaDominican RepublicEarly-demographic dividendEast Asia & PacificEast Asia & Pacific (excluding high income)East Asia & Pacific (IDA & IBRD countries)EcuadorEgypt, Arab Rep.El SalvadorEquatorial GuineaEstoniaEthiopiaEuro areaEurope & Central AsiaEurope & Central Asia (excluding high income)Europe & Central Asia (IDA & IBRD countries)European UnionFijiFinlandFragile and conflict affected situationsFranceGabonGambia, TheGeorgiaGermanyGhanaGreeceGrenadaGuatemalaGuineaGuinea-BissauGuyanaHeavily indebted poor countries (HIPC)High incomeHondurasHong Kong SAR, ChinaHungaryIBRD onlyIcelandIDA & IBRD totalIDA blendIDA onlyIDA totalIndiaIndonesiaIran, Islamic Rep.IraqIrelandItalyJamaicaJapanJordanKazakhstanKenyaKiribatiKorea, Rep.KosovoKuwaitKyrgyz RepublicLao PDRLate-demographic dividendLatin America & Caribbean Latin America & Caribbean (excluding high income)Latin America & the Caribbean (IDA & IBRD countries)LatviaLeast developed countries: UN classificationLebanonLesothoLiberiaLiechtensteinLithuaniaLow & middle incomeLow incomeLower middle incomeLuxembourgMacao SAR, ChinaMacedonia, FYRMadagascarMalawiMalaysiaMaldivesMaliMaltaMarshall IslandsMauritaniaMauritiusMexicoMicronesia, Fed. Sts.Middle East & North AfricaMiddle East & North Africa (excluding high income)Middle East & North Africa (IDA & IBRD countries)Middle incomeMoldovaMongoliaMontenegroMoroccoMozambiqueMyanmarNamibiaNepalNetherlandsNew ZealandNicaraguaNigerNigeriaNorth AmericaNorwayOECD membersOmanOther small statesPacific island small statesPakistanPalauPanamaParaguayPeruPhilippinesPolandPortugalPost-demographic dividendPre-demographic dividendPuerto RicoQatarRomaniaRussian FederationRwandaSamoaSao Tome and PrincipeSaudi ArabiaSenegalSerbiaSeychellesSierra LeoneSingaporeSlovak RepublicSloveniaSmall statesSouth AfricaSouth AsiaSouth Asia (IDA & IBRD)SpainSri LankaSt. Kitts and NevisSt. LuciaSt. Vincent and the GrenadinesSub-Saharan Africa Sub-Saharan Africa (excluding high income)Sub-Saharan Africa (IDA & IBRD countries)SudanSurinameSwazilandSwedenSwitzerlandTajikistanTanzaniaThailandTimor-LesteTogoTongaTrinidad and TobagoTunisiaTurkeyTurkmenistanTuvaluUgandaUkraineUnited Arab EmiratesUnited KingdomUnited StatesUpper middle incomeUruguayUzbekistanVanuatuVenezuela, RBVietnamWest Bank and GazaWorldYemen, Rep.ZambiaZimbabwe Timeline:
This timeline shows a graph from 1961 to 2016 of Congo, Rep.. No data until 1960. Number of actual observations by date: 56.
Source name:
World Development Indicators
Source organization:
World Bank national accounts data, and OECD National Accounts data files.
Categories, topics:
Economy & Growth
Last updated:
apr 23, 2017
Indicators value changes by year
Minimum:
421.304 mln
jan 1, 1961
Maximum:
9.051 bln
jan 1, 2011
At the date of observation
Value
Absolute change
Change from previous value
jan 1, 1961
421.304 mln
+421.304 mln
0.0%
jan 1, 1962
479.764 mln
+58.459 mln
13.88%
jan 1, 1963
503.472 mln
+23.708 mln
4.94%
jan 1, 1964
483.151 mln
-20.321 mln
-4.04%
jan 1, 1965
500.085 mln
+16.934 mln
3.5%
jan 1, 1966
550.884 mln
+50.799 mln
10.16%
jan 1, 1967
581.365 mln
+30.481 mln
5.53%
jan 1, 1968
733.765 mln
+152.4 mln
26.21%
jan 1, 1969
737.866 mln
+4.101 mln
0.56%
jan 1, 1970
764.245 mln
+26.379 mln
3.58%
jan 1, 1971
880.85 mln
+116.605 mln
15.26%
jan 1, 1972
889.509 mln
+8.659 mln
0.98%
jan 1, 1973
949.842 mln
+60.333 mln
6.78%
jan 1, 1974
1.088 bln
+137.932 mln
14.52%
jan 1, 1975
1.358 bln
+270.692 mln
24.88%
jan 1, 1976
1.717 bln
+358.281 mln
26.37%
jan 1, 1977
1.886 bln
+168.955 mln
9.84%
jan 1, 1978
1.509 bln
-376.738 mln
-19.98%
jan 1, 1979
1.576 bln
+67.477 mln
4.47%
jan 1, 1980
1.962 bln
+386.024 mln
24.49%
jan 1, 1981
2.448 bln
+485.76 mln
24.75%
jan 1, 1982
2.355 bln
-92.995 mln
-3.8%
jan 1, 1983
3.315 bln
+959.339 mln
40.73%
jan 1, 1984
3.894 bln
+579.376 mln
17.48%
jan 1, 1985
4.228 bln
+334.152 mln
8.58%
jan 1, 1986
4.023 bln
-204.803 mln
-4.84%
jan 1, 1987
3.676 bln
-347.06 mln
-8.63%
jan 1, 1988
3.735 bln
+58.45 mln
1.59%
jan 1, 1989
3.846 bln
+111.186 mln
2.98%
jan 1, 1990
4.244 bln
+398.395 mln
10.36%
jan 1, 1991
4.433 bln
+188.58 mln
4.44%
jan 1, 1992
4.448 bln
+15.029 mln
0.34%
jan 1, 1993
4.585 bln
+137.34 mln
3.09%
jan 1, 1994
4.807 bln
+222.243 mln
4.85%
jan 1, 1995
4.657 bln
-150.187 mln
-3.12%
jan 1, 1996
4.894 bln
+236.465 mln
5.08%
jan 1, 1997
5.208 bln
+314.091 mln
6.42%
jan 1, 1998
5.857 bln
+648.696 mln
12.46%
jan 1, 1999
6.187 bln
+330.344 mln
5.64%
jan 1, 2000
6.382 bln
+195.457 mln
3.16%
jan 1, 2001
6.571 bln
+188.364 mln
2.95%
jan 1, 2002
6.365 bln
-205.54 mln
-3.13%
jan 1, 2003
6.452 bln
+87.311 mln
1.37%
jan 1, 2004
6.209 bln
-243.327 mln
-3.77%
jan 1, 2005
6.337 bln
+127.389 mln
2.05%
jan 1, 2006
7.052 bln
+715.668 mln
11.29%
jan 1, 2007
7.552 bln
+499.536 mln
7.08%
jan 1, 2008
6.773 bln
-779.213 mln
-10.32%
jan 1, 2009
7.194 bln
+421.558 mln
6.22%
jan 1, 2010
8.112 bln
+918.332 mln
12.77%
jan 1, 2011
9.051 bln
+938.803 mln
11.57%
jan 1, 2012
8.963 bln
-88.534 mln
-0.98%
jan 1, 2013
8.646 bln
-316.875 mln
-3.54%
jan 1, 2014
8.359 bln
-286.975 mln
-3.32%
jan 1, 2015
8.834 bln
+474.843 mln
5.68%
jan 1, 2016
8.853 bln
+19.532 mln
0.22%
Ranking of countries by current statistics by years


Comments: