29
/
en
AIzaSyAYiBZKx7MnpbEhh9jyipgxe19OcubqV5w
April 1, 2024
250908
St. Lucia
LCA
true
2
1
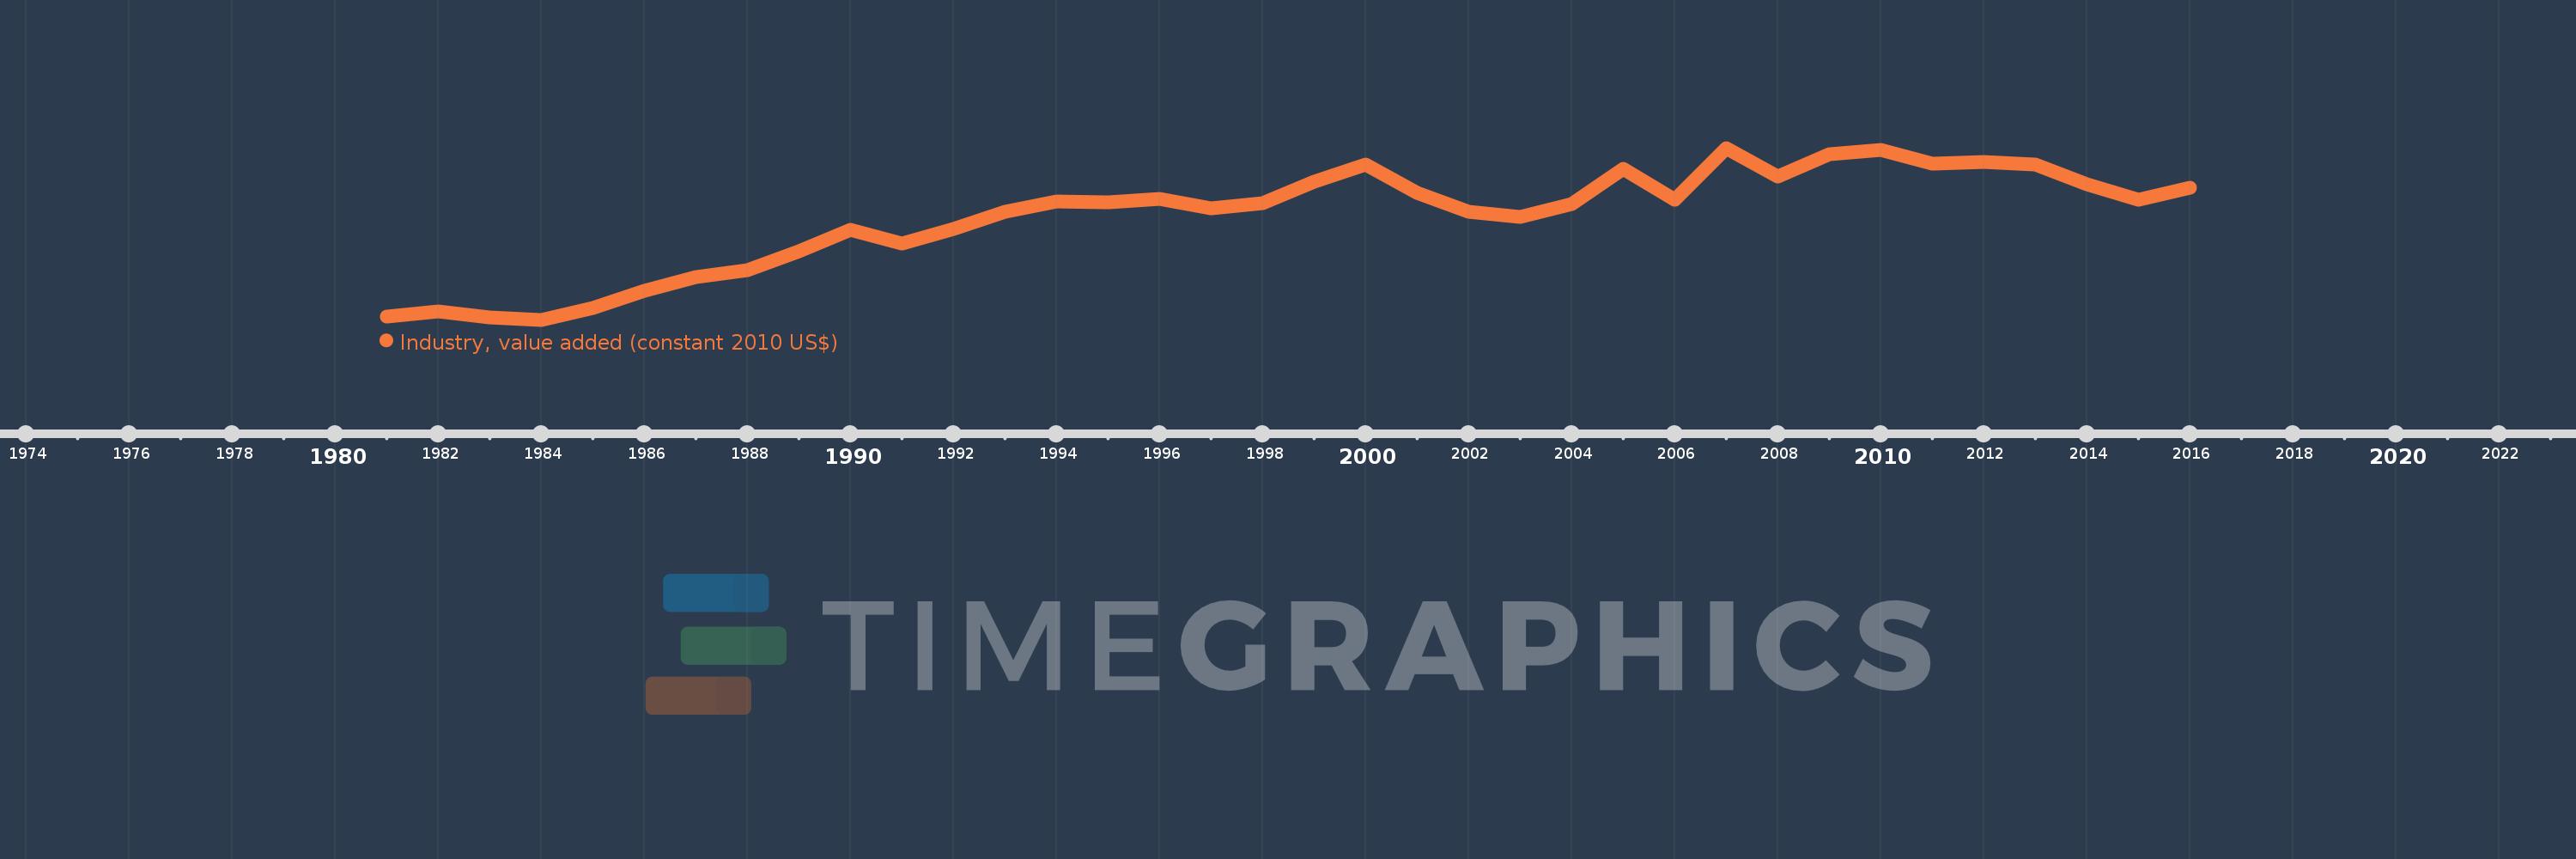
Industry, value added (constant 2010 US$)
2016,2015,2014,2013,2012,2011,2010,2009,2008,2007,2006,2005,2004,2003,2002,2001,2000,1999,1998,1997,1996,1995,1994,1993,1992,1991,1990,1989,1988,1987,1986,1985,1984,1983,1982,1981
This statistics in other country:
AfghanistanAlbaniaAlgeriaAndorraAntigua and BarbudaArab WorldArgentinaArmeniaArubaAustraliaAustriaAzerbaijanBahamas, TheBahrainBangladeshBarbadosBelarusBelgiumBelizeBeninBermudaBhutanBoliviaBosnia and HerzegovinaBotswanaBrazilBrunei DarussalamBulgariaBurkina FasoBurundiCabo VerdeCambodiaCameroonCanadaCaribbean small statesCentral African RepublicCentral Europe and the BalticsChadChileChinaColombiaComorosCongo, Dem. Rep.Congo, Rep.Costa RicaCote d'IvoireCroatiaCubaCyprusCzech RepublicDenmarkDominicaDominican RepublicEarly-demographic dividendEast Asia & PacificEast Asia & Pacific (excluding high income)East Asia & Pacific (IDA & IBRD countries)EcuadorEgypt, Arab Rep.El SalvadorEquatorial GuineaEstoniaEthiopiaEuro areaEurope & Central AsiaEurope & Central Asia (excluding high income)Europe & Central Asia (IDA & IBRD countries)European UnionFijiFinlandFragile and conflict affected situationsFranceGabonGambia, TheGeorgiaGermanyGhanaGreeceGrenadaGuatemalaGuineaGuinea-BissauGuyanaHeavily indebted poor countries (HIPC)High incomeHondurasHong Kong SAR, ChinaHungaryIBRD onlyIcelandIDA & IBRD totalIDA blendIDA onlyIDA totalIndiaIndonesiaIran, Islamic Rep.IraqIrelandItalyJamaicaJapanJordanKazakhstanKenyaKiribatiKorea, Rep.KosovoKuwaitKyrgyz RepublicLao PDRLate-demographic dividendLatin America & Caribbean Latin America & Caribbean (excluding high income)Latin America & the Caribbean (IDA & IBRD countries)LatviaLeast developed countries: UN classificationLebanonLesothoLiberiaLiechtensteinLithuaniaLow & middle incomeLow incomeLower middle incomeLuxembourgMacao SAR, ChinaMacedonia, FYRMadagascarMalawiMalaysiaMaldivesMaliMaltaMarshall IslandsMauritaniaMauritiusMexicoMicronesia, Fed. Sts.Middle East & North AfricaMiddle East & North Africa (excluding high income)Middle East & North Africa (IDA & IBRD countries)Middle incomeMoldovaMongoliaMontenegroMoroccoMozambiqueMyanmarNamibiaNepalNetherlandsNew ZealandNicaraguaNigerNigeriaNorth AmericaNorwayOECD membersOmanOther small statesPacific island small statesPakistanPalauPanamaParaguayPeruPhilippinesPolandPortugalPost-demographic dividendPre-demographic dividendPuerto RicoQatarRomaniaRussian FederationRwandaSamoaSao Tome and PrincipeSaudi ArabiaSenegalSerbiaSeychellesSierra LeoneSingaporeSlovak RepublicSloveniaSmall statesSouth AfricaSouth AsiaSouth Asia (IDA & IBRD)SpainSri LankaSt. Kitts and NevisSt. LuciaSt. Vincent and the GrenadinesSub-Saharan Africa Sub-Saharan Africa (excluding high income)Sub-Saharan Africa (IDA & IBRD countries)SudanSurinameSwazilandSwedenSwitzerlandTajikistanTanzaniaThailandTimor-LesteTogoTongaTrinidad and TobagoTunisiaTurkeyTurkmenistanTuvaluUgandaUkraineUnited Arab EmiratesUnited KingdomUnited StatesUpper middle incomeUruguayUzbekistanVanuatuVenezuela, RBVietnamWest Bank and GazaWorldYemen, Rep.ZambiaZimbabwe Timeline:
This timeline shows a graph from 1981 to 2016 of St. Lucia. No data until 1980. Number of actual observations by date: 36.
Source name:
World Development Indicators
Source organization:
World Bank national accounts data, and OECD National Accounts data files.
Categories, topics:
Economy & Growth
Last updated:
apr 23, 2017
Indicators value changes by year
Minimum:
52.796 mln
jan 1, 1984
Maximum:
182.313 mln
jan 1, 2007
At the date of observation
Value
Absolute change
Change from previous value
jan 1, 1981
55.265 mln
+55.265 mln
0.0%
jan 1, 1982
58.754 mln
+3.49 mln
6.31%
jan 1, 1983
54.562 mln
-4.193 mln
-7.14%
jan 1, 1984
52.796 mln
-1.765 mln
-3.24%
jan 1, 1985
61.514 mln
+8.717 mln
16.51%
jan 1, 1986
74.694 mln
+13.181 mln
21.43%
jan 1, 1987
85.197 mln
+10.502 mln
14.06%
jan 1, 1988
90.262 mln
+5.065 mln
5.95%
jan 1, 1989
104.389 mln
+14.127 mln
15.65%
jan 1, 1990
120.41 mln
+16.021 mln
15.35%
jan 1, 1991
110.192 mln
-10.218 mln
-8.49%
jan 1, 1992
121.059 mln
+10.868 mln
9.86%
jan 1, 1993
133.942 mln
+12.883 mln
10.64%
jan 1, 1994
141.902 mln
+7.96 mln
5.94%
jan 1, 1995
141.449 mln
-453.12K
-0.32%
jan 1, 1996
144.188 mln
+2.739 mln
1.94%
jan 1, 1997
137.012 mln
-7.175 mln
-4.98%
jan 1, 1998
140.563 mln
+3.55 mln
2.59%
jan 1, 1999
156.827 mln
+16.264 mln
11.57%
jan 1, 2000
170.069 mln
+13.241 mln
8.44%
jan 1, 2001
148.573 mln
-21.496 mln
-12.64%
jan 1, 2002
133.917 mln
-14.655 mln
-9.86%
jan 1, 2003
130.225 mln
-3.692 mln
-2.76%
jan 1, 2004
140.036 mln
+9.81 mln
7.53%
jan 1, 2005
166.421 mln
+26.385 mln
18.84%
jan 1, 2006
143.285 mln
-23.137 mln
-13.9%
jan 1, 2007
182.313 mln
+39.028 mln
27.24%
jan 1, 2008
160.814 mln
-21.499 mln
-11.79%
jan 1, 2009
177.338 mln
+16.524 mln
10.28%
jan 1, 2010
180.76 mln
+3.421 mln
1.93%
jan 1, 2011
170.598 mln
-10.162 mln
-5.62%
jan 1, 2012
171.951 mln
+1.353 mln
0.79%
jan 1, 2013
169.668 mln
-2.283 mln
-1.33%
jan 1, 2014
154.816 mln
-14.851 mln
-8.75%
jan 1, 2015
143.069 mln
-11.748 mln
-7.59%
jan 1, 2016
152.456 mln
+9.388 mln
6.56%
Ranking of countries by current statistics by years


Comments: