29
/
en
AIzaSyAYiBZKx7MnpbEhh9jyipgxe19OcubqV5w
April 1, 2024
252012
St. Vincent and the Grenadines
VCT
true
2
1
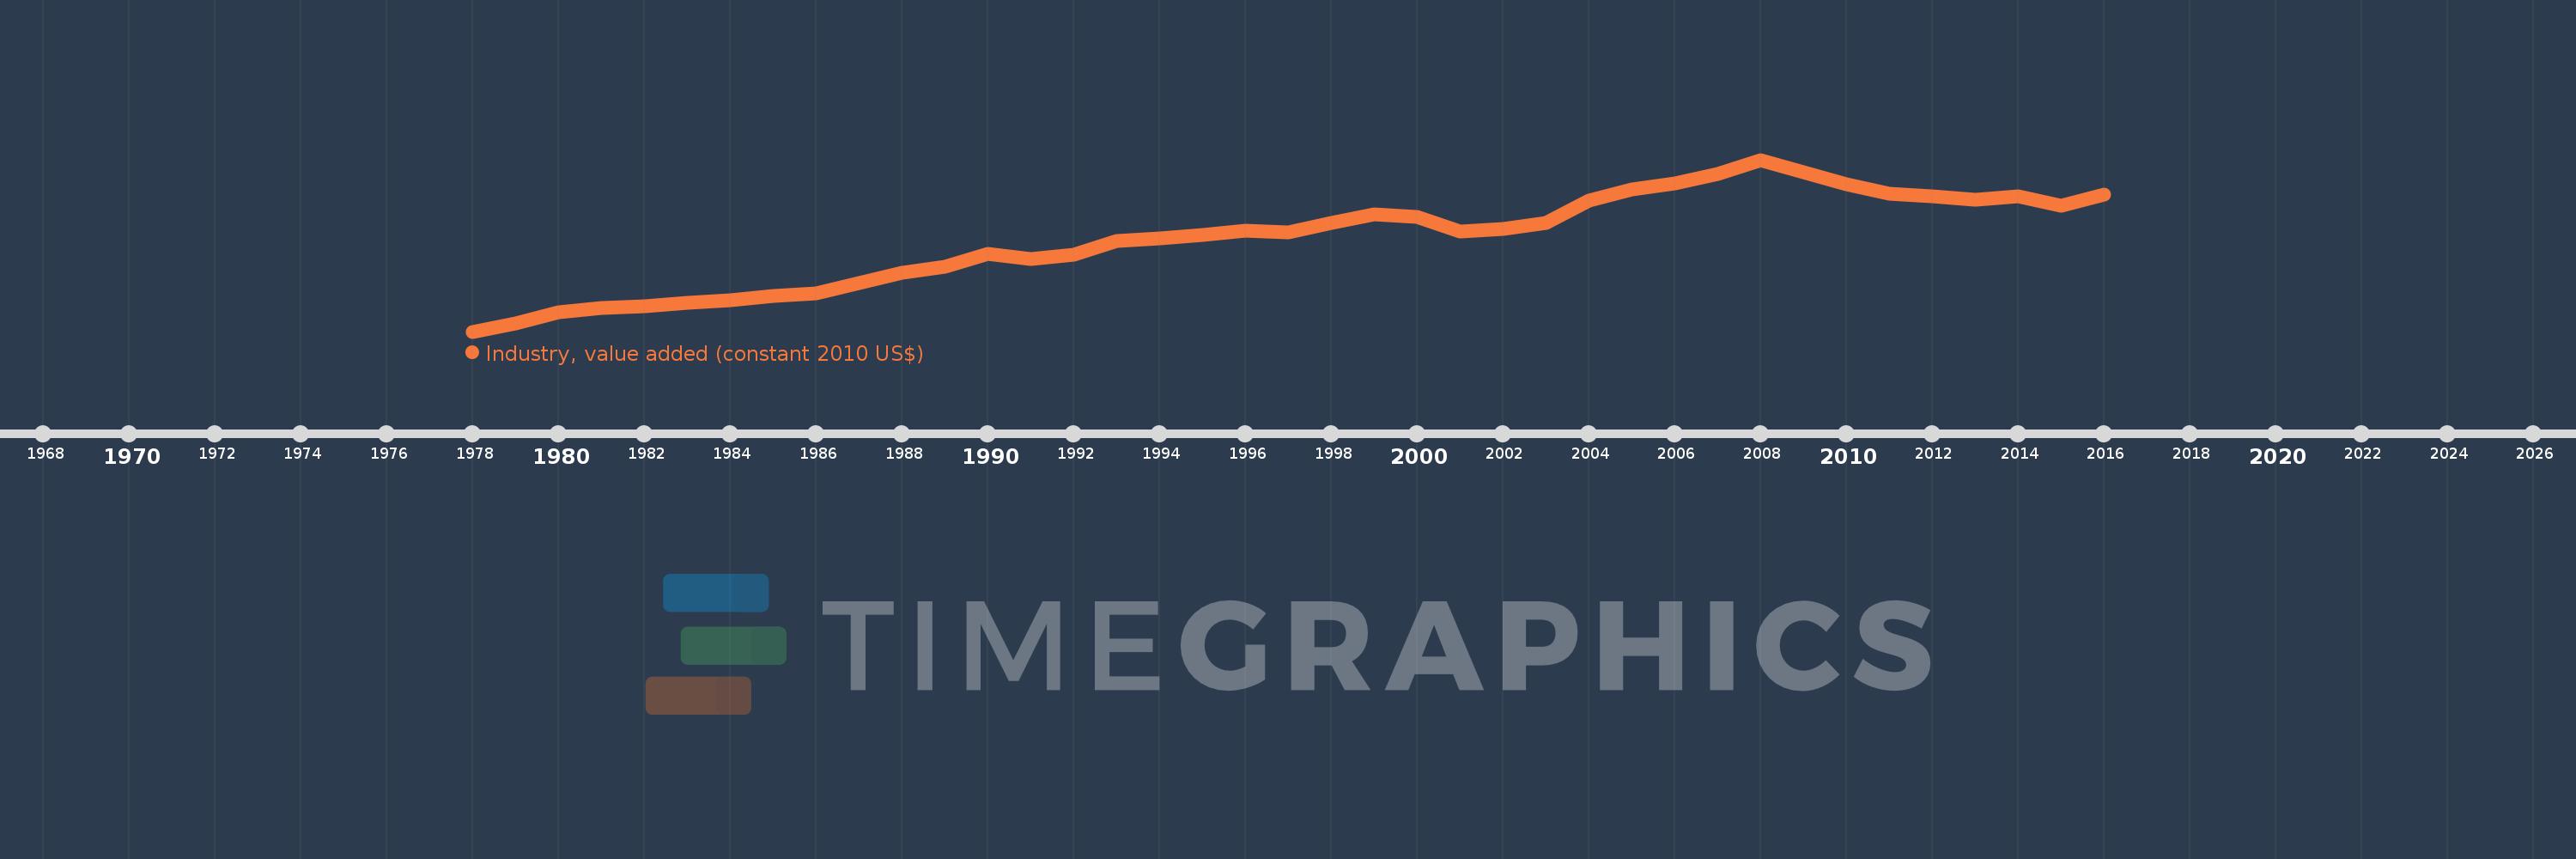
Industry, value added (constant 2010 US$)
2016,2015,2014,2013,2012,2011,2010,2009,2008,2007,2006,2005,2004,2003,2002,2001,2000,1999,1998,1997,1996,1995,1994,1993,1992,1991,1990,1989,1988,1987,1986,1985,1984,1983,1982,1981,1980,1979,1978
This statistics in other country:
AfghanistanAlbaniaAlgeriaAndorraAntigua and BarbudaArab WorldArgentinaArmeniaArubaAustraliaAustriaAzerbaijanBahamas, TheBahrainBangladeshBarbadosBelarusBelgiumBelizeBeninBermudaBhutanBoliviaBosnia and HerzegovinaBotswanaBrazilBrunei DarussalamBulgariaBurkina FasoBurundiCabo VerdeCambodiaCameroonCanadaCaribbean small statesCentral African RepublicCentral Europe and the BalticsChadChileChinaColombiaComorosCongo, Dem. Rep.Congo, Rep.Costa RicaCote d'IvoireCroatiaCubaCyprusCzech RepublicDenmarkDominicaDominican RepublicEarly-demographic dividendEast Asia & PacificEast Asia & Pacific (excluding high income)East Asia & Pacific (IDA & IBRD countries)EcuadorEgypt, Arab Rep.El SalvadorEquatorial GuineaEstoniaEthiopiaEuro areaEurope & Central AsiaEurope & Central Asia (excluding high income)Europe & Central Asia (IDA & IBRD countries)European UnionFijiFinlandFragile and conflict affected situationsFranceGabonGambia, TheGeorgiaGermanyGhanaGreeceGrenadaGuatemalaGuineaGuinea-BissauGuyanaHeavily indebted poor countries (HIPC)High incomeHondurasHong Kong SAR, ChinaHungaryIBRD onlyIcelandIDA & IBRD totalIDA blendIDA onlyIDA totalIndiaIndonesiaIran, Islamic Rep.IraqIrelandItalyJamaicaJapanJordanKazakhstanKenyaKiribatiKorea, Rep.KosovoKuwaitKyrgyz RepublicLao PDRLate-demographic dividendLatin America & Caribbean Latin America & Caribbean (excluding high income)Latin America & the Caribbean (IDA & IBRD countries)LatviaLeast developed countries: UN classificationLebanonLesothoLiberiaLiechtensteinLithuaniaLow & middle incomeLow incomeLower middle incomeLuxembourgMacao SAR, ChinaMacedonia, FYRMadagascarMalawiMalaysiaMaldivesMaliMaltaMarshall IslandsMauritaniaMauritiusMexicoMicronesia, Fed. Sts.Middle East & North AfricaMiddle East & North Africa (excluding high income)Middle East & North Africa (IDA & IBRD countries)Middle incomeMoldovaMongoliaMontenegroMoroccoMozambiqueMyanmarNamibiaNepalNetherlandsNew ZealandNicaraguaNigerNigeriaNorth AmericaNorwayOECD membersOmanOther small statesPacific island small statesPakistanPalauPanamaParaguayPeruPhilippinesPolandPortugalPost-demographic dividendPre-demographic dividendPuerto RicoQatarRomaniaRussian FederationRwandaSamoaSao Tome and PrincipeSaudi ArabiaSenegalSerbiaSeychellesSierra LeoneSingaporeSlovak RepublicSloveniaSmall statesSouth AfricaSouth AsiaSouth Asia (IDA & IBRD)SpainSri LankaSt. Kitts and NevisSt. LuciaSt. Vincent and the GrenadinesSub-Saharan Africa Sub-Saharan Africa (excluding high income)Sub-Saharan Africa (IDA & IBRD countries)SudanSurinameSwazilandSwedenSwitzerlandTajikistanTanzaniaThailandTimor-LesteTogoTongaTrinidad and TobagoTunisiaTurkeyTurkmenistanTuvaluUgandaUkraineUnited Arab EmiratesUnited KingdomUnited StatesUpper middle incomeUruguayUzbekistanVanuatuVenezuela, RBVietnamWest Bank and GazaWorldYemen, Rep.ZambiaZimbabwe Timeline:
This timeline shows a graph from 1978 to 2016 of St. Vincent and the Grenadines. No data until 1977. Number of actual observations by date: 39.
Source name:
World Development Indicators
Source organization:
World Bank national accounts data, and OECD National Accounts data files.
Categories, topics:
Economy & Growth
Last updated:
apr 23, 2017
Indicators value changes by year
Minimum:
32.989 mln
jan 1, 1978
Maximum:
131.531 mln
jan 1, 2008
At the date of observation
Value
Absolute change
Change from previous value
jan 1, 1978
32.989 mln
+32.989 mln
0.0%
jan 1, 1979
37.57 mln
+4.581 mln
13.89%
jan 1, 1980
44.257 mln
+6.687 mln
17.8%
jan 1, 1981
46.463 mln
+2.206 mln
4.98%
jan 1, 1982
47.549 mln
+1.087 mln
2.34%
jan 1, 1983
49.392 mln
+1.842 mln
3.87%
jan 1, 1984
50.943 mln
+1.552 mln
3.14%
jan 1, 1985
53.4 mln
+2.457 mln
4.82%
jan 1, 1986
54.77 mln
+1.37 mln
2.57%
jan 1, 1987
60.702 mln
+5.932 mln
10.83%
jan 1, 1988
66.67 mln
+5.967 mln
9.83%
jan 1, 1989
70.344 mln
+3.675 mln
5.51%
jan 1, 1990
77.686 mln
+7.342 mln
10.44%
jan 1, 1991
74.431 mln
-3.255 mln
-4.19%
jan 1, 1992
76.892 mln
+2.46 mln
3.31%
jan 1, 1993
85.128 mln
+8.236 mln
10.71%
jan 1, 1994
86.517 mln
+1.389 mln
1.63%
jan 1, 1995
88.285 mln
+1.768 mln
2.04%
jan 1, 1996
90.775 mln
+2.49 mln
2.82%
jan 1, 1997
89.655 mln
-1.12 mln
-1.23%
jan 1, 1998
95.563 mln
+5.907 mln
6.59%
jan 1, 1999
100.035 mln
+4.472 mln
4.68%
jan 1, 2000
98.745 mln
-1.289 mln
-1.29%
jan 1, 2001
90.553 mln
-8.192 mln
-8.3%
jan 1, 2002
92.016 mln
+1.463 mln
1.62%
jan 1, 2003
95.386 mln
+3.37 mln
3.66%
jan 1, 2004
108.038 mln
+12.652 mln
13.26%
jan 1, 2005
114.31 mln
+6.272 mln
5.81%
jan 1, 2006
118.046 mln
+3.736 mln
3.27%
jan 1, 2007
123.577 mln
+5.531 mln
4.69%
jan 1, 2008
131.531 mln
+7.954 mln
6.44%
jan 1, 2009
124.238 mln
-7.292 mln
-5.54%
jan 1, 2010
117.285 mln
-6.953 mln
-5.6%
jan 1, 2011
112.274 mln
-5.011 mln
-4.27%
jan 1, 2012
110.703 mln
-1.571 mln
-1.4%
jan 1, 2013
108.419 mln
-2.284 mln
-2.06%
jan 1, 2014
110.542 mln
+2.123 mln
1.96%
jan 1, 2015
105.353 mln
-5.189 mln
-4.69%
jan 1, 2016
111.41 mln
+6.057 mln
5.75%
Ranking of countries by current statistics by years


Comments: