29
/
en
AIzaSyAYiBZKx7MnpbEhh9jyipgxe19OcubqV5w
April 1, 2024
245740
South Africa
ZAF
true
2
1
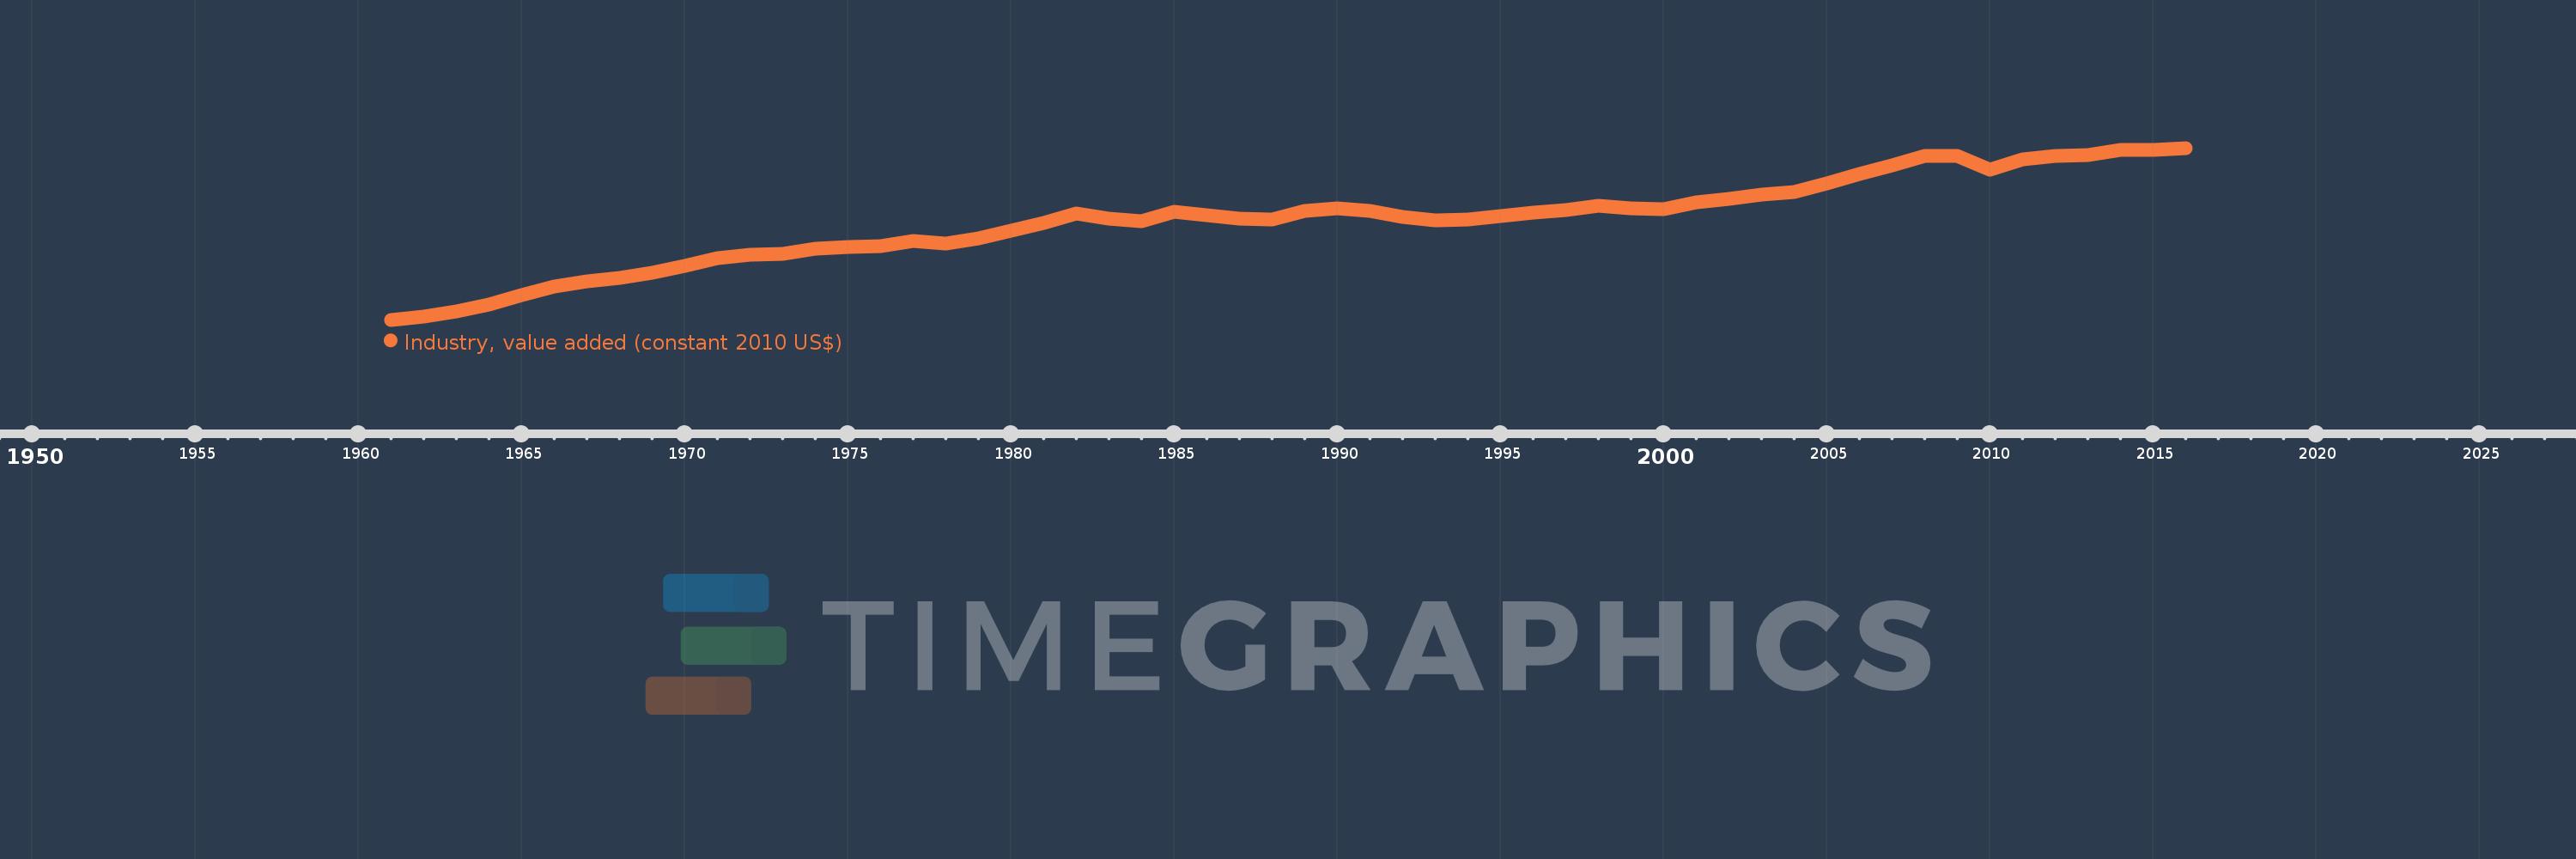
Industry, value added (constant 2010 US$)
2016,2015,2014,2013,2012,2011,2010,2009,2008,2007,2006,2005,2004,2003,2002,2001,2000,1999,1998,1997,1996,1995,1994,1993,1992,1991,1990,1989,1988,1987,1986,1985,1984,1983,1982,1981,1980,1979,1978,1977,1976,1975,1974,1973,1972,1971,1970,1969,1968,1967,1966,1965,1964,1963,1962,1961
This statistics in other country:
AfghanistanAlbaniaAlgeriaAndorraAntigua and BarbudaArab WorldArgentinaArmeniaArubaAustraliaAustriaAzerbaijanBahamas, TheBahrainBangladeshBarbadosBelarusBelgiumBelizeBeninBermudaBhutanBoliviaBosnia and HerzegovinaBotswanaBrazilBrunei DarussalamBulgariaBurkina FasoBurundiCabo VerdeCambodiaCameroonCanadaCaribbean small statesCentral African RepublicCentral Europe and the BalticsChadChileChinaColombiaComorosCongo, Dem. Rep.Congo, Rep.Costa RicaCote d'IvoireCroatiaCubaCyprusCzech RepublicDenmarkDominicaDominican RepublicEarly-demographic dividendEast Asia & PacificEast Asia & Pacific (excluding high income)East Asia & Pacific (IDA & IBRD countries)EcuadorEgypt, Arab Rep.El SalvadorEquatorial GuineaEstoniaEthiopiaEuro areaEurope & Central AsiaEurope & Central Asia (excluding high income)Europe & Central Asia (IDA & IBRD countries)European UnionFijiFinlandFragile and conflict affected situationsFranceGabonGambia, TheGeorgiaGermanyGhanaGreeceGrenadaGuatemalaGuineaGuinea-BissauGuyanaHeavily indebted poor countries (HIPC)High incomeHondurasHong Kong SAR, ChinaHungaryIBRD onlyIcelandIDA & IBRD totalIDA blendIDA onlyIDA totalIndiaIndonesiaIran, Islamic Rep.IraqIrelandItalyJamaicaJapanJordanKazakhstanKenyaKiribatiKorea, Rep.KosovoKuwaitKyrgyz RepublicLao PDRLate-demographic dividendLatin America & Caribbean Latin America & Caribbean (excluding high income)Latin America & the Caribbean (IDA & IBRD countries)LatviaLeast developed countries: UN classificationLebanonLesothoLiberiaLiechtensteinLithuaniaLow & middle incomeLow incomeLower middle incomeLuxembourgMacao SAR, ChinaMacedonia, FYRMadagascarMalawiMalaysiaMaldivesMaliMaltaMarshall IslandsMauritaniaMauritiusMexicoMicronesia, Fed. Sts.Middle East & North AfricaMiddle East & North Africa (excluding high income)Middle East & North Africa (IDA & IBRD countries)Middle incomeMoldovaMongoliaMontenegroMoroccoMozambiqueMyanmarNamibiaNepalNetherlandsNew ZealandNicaraguaNigerNigeriaNorth AmericaNorwayOECD membersOmanOther small statesPacific island small statesPakistanPalauPanamaParaguayPeruPhilippinesPolandPortugalPost-demographic dividendPre-demographic dividendPuerto RicoQatarRomaniaRussian FederationRwandaSamoaSao Tome and PrincipeSaudi ArabiaSenegalSerbiaSeychellesSierra LeoneSingaporeSlovak RepublicSloveniaSmall statesSouth AfricaSouth AsiaSouth Asia (IDA & IBRD)SpainSri LankaSt. Kitts and NevisSt. LuciaSt. Vincent and the GrenadinesSub-Saharan Africa Sub-Saharan Africa (excluding high income)Sub-Saharan Africa (IDA & IBRD countries)SudanSurinameSwazilandSwedenSwitzerlandTajikistanTanzaniaThailandTimor-LesteTogoTongaTrinidad and TobagoTunisiaTurkeyTurkmenistanTuvaluUgandaUkraineUnited Arab EmiratesUnited KingdomUnited StatesUpper middle incomeUruguayUzbekistanVanuatuVenezuela, RBVietnamWest Bank and GazaWorldYemen, Rep.ZambiaZimbabwe Timeline:
This timeline shows a graph from 1961 to 2016 of South Africa. No data until 1960. Number of actual observations by date: 56.
Source name:
World Development Indicators
Source organization:
World Bank national accounts data, and OECD National Accounts data files.
Categories, topics:
Economy & Growth
Last updated:
apr 23, 2017
Indicators value changes by year
Minimum:
31.469 bln
jan 1, 1961
Maximum:
107.865 bln
jan 1, 2016
At the date of observation
Value
Absolute change
Change from previous value
jan 1, 1961
31.469 bln
+31.469 bln
0.0%
jan 1, 1962
32.92 bln
+1.451 bln
4.61%
jan 1, 1963
35.263 bln
+2.343 bln
7.12%
jan 1, 1964
38.252 bln
+2.988 bln
8.47%
jan 1, 1965
42.534 bln
+4.282 bln
11.19%
jan 1, 1966
46.436 bln
+3.902 bln
9.17%
jan 1, 1967
48.521 bln
+2.085 bln
4.49%
jan 1, 1968
50.042 bln
+1.522 bln
3.14%
jan 1, 1969
52.409 bln
+2.367 bln
4.73%
jan 1, 1970
55.604 bln
+3.195 bln
6.1%
jan 1, 1971
58.848 bln
+3.244 bln
5.83%
jan 1, 1972
60.204 bln
+1.356 bln
2.3%
jan 1, 1973
60.587 bln
+383.658 mln
0.64%
jan 1, 1974
63.003 bln
+2.416 bln
3.99%
jan 1, 1975
63.793 bln
+790.449 mln
1.25%
jan 1, 1976
64.128 bln
+335.099 mln
0.53%
jan 1, 1977
66.348 bln
+2.219 bln
3.46%
jan 1, 1978
65.462 bln
-885.734 mln
-1.33%
jan 1, 1979
67.491 bln
+2.03 bln
3.1%
jan 1, 1980
71.168 bln
+3.676 bln
5.45%
jan 1, 1981
74.428 bln
+3.26 bln
4.58%
jan 1, 1982
78.708 bln
+4.28 bln
5.75%
jan 1, 1983
76.395 bln
-2.313 bln
-2.94%
jan 1, 1984
75.324 bln
-1.07 bln
-1.4%
jan 1, 1985
79.354 bln
+4.03 bln
5.35%
jan 1, 1986
77.95 bln
-1.404 bln
-1.77%
jan 1, 1987
76.585 bln
-1.365 bln
-1.75%
jan 1, 1988
76.102 bln
-483.065 mln
-0.63%
jan 1, 1989
79.7 bln
+3.598 bln
4.73%
jan 1, 1990
80.979 bln
+1.279 bln
1.61%
jan 1, 1991
79.911 bln
-1.069 bln
-1.32%
jan 1, 1992
77.141 bln
-2.77 bln
-3.47%
jan 1, 1993
75.762 bln
-1.378 bln
-1.79%
jan 1, 1994
76.027 bln
+264.552 mln
0.35%
jan 1, 1995
77.567 bln
+1.54 bln
2.03%
jan 1, 1996
78.965 bln
+1.398 bln
1.8%
jan 1, 1997
80.058 bln
+1.093 bln
1.38%
jan 1, 1998
82.038 bln
+1.979 bln
2.47%
jan 1, 1999
81.076 bln
-961.559 mln
-1.17%
jan 1, 2000
80.724 bln
-351.954 mln
-0.43%
jan 1, 2001
83.823 bln
+3.098 bln
3.84%
jan 1, 2002
85.032 bln
+1.209 bln
1.44%
jan 1, 2003
87.082 bln
+2.051 bln
2.41%
jan 1, 2004
88.268 bln
+1.186 bln
1.36%
jan 1, 2005
91.92 bln
+3.652 bln
4.14%
jan 1, 2006
96.258 bln
+4.338 bln
4.72%
jan 1, 2007
100.157 bln
+3.899 bln
4.05%
jan 1, 2008
104.287 bln
+4.131 bln
4.12%
jan 1, 2009
104.416 bln
+128.755 mln
0.12%
jan 1, 2010
98.156 bln
-6.26 bln
-6.0%
jan 1, 2011
102.776 bln
+4.62 bln
4.71%
jan 1, 2012
104.227 bln
+1.451 bln
1.41%
jan 1, 2013
104.68 bln
+453.479 mln
0.44%
jan 1, 2014
106.858 bln
+2.177 bln
2.08%
jan 1, 2015
106.86 bln
+2.595 mln
0.0%
jan 1, 2016
107.865 bln
+1.004 bln
0.94%
Ranking of countries by current statistics by years


Comments: