29
/
en
AIzaSyAYiBZKx7MnpbEhh9jyipgxe19OcubqV5w
April 1, 2024
62701
World
WLD
false
2
1
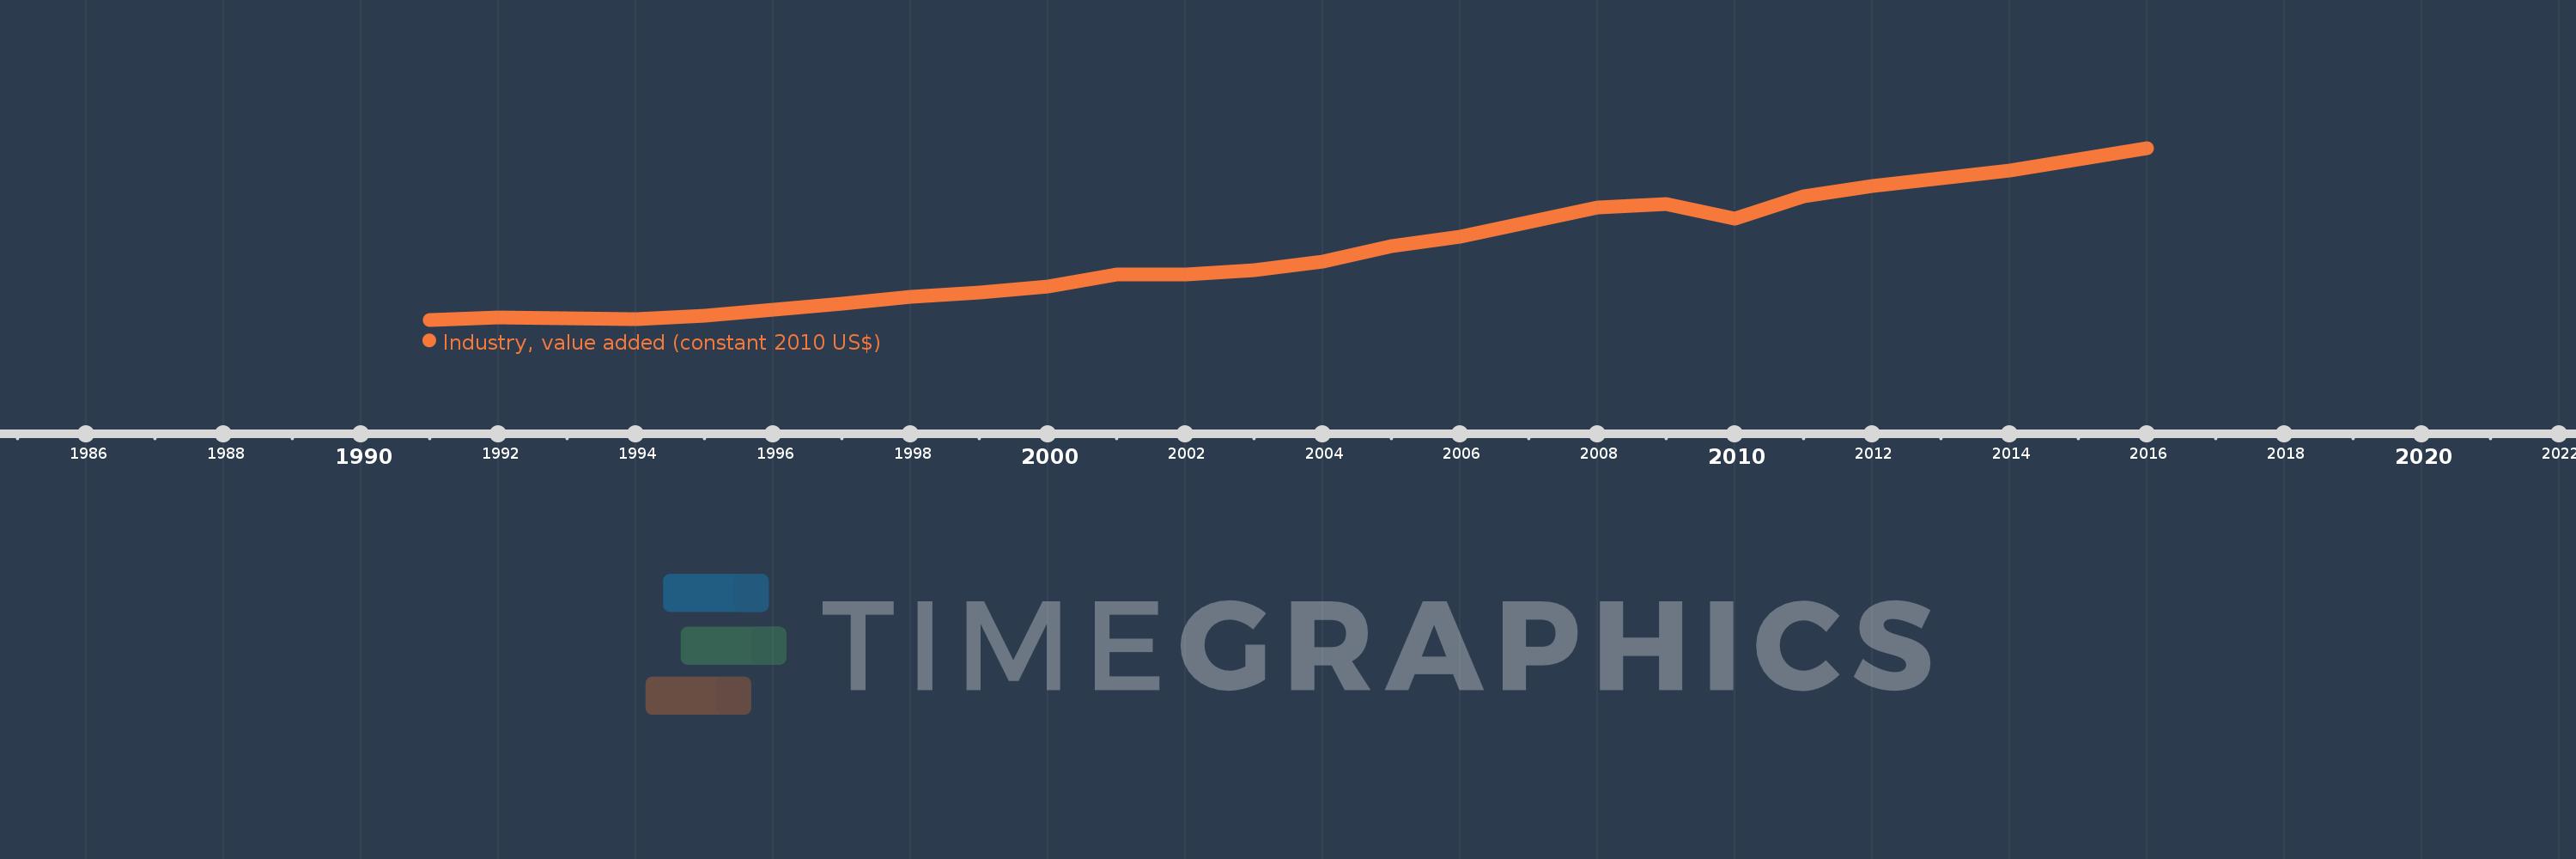
Industry, value added (constant 2010 US$)
2016,2015,2014,2013,2012,2011,2010,2009,2008,2007,2006,2005,2004,2003,2002,2001,2000,1999,1998,1997,1996,1995,1994,1993,1992,1991
This statistics in other country:
AfghanistanAlbaniaAlgeriaAndorraAntigua and BarbudaArab WorldArgentinaArmeniaArubaAustraliaAustriaAzerbaijanBahamas, TheBahrainBangladeshBarbadosBelarusBelgiumBelizeBeninBermudaBhutanBoliviaBosnia and HerzegovinaBotswanaBrazilBrunei DarussalamBulgariaBurkina FasoBurundiCabo VerdeCambodiaCameroonCanadaCaribbean small statesCentral African RepublicCentral Europe and the BalticsChadChileChinaColombiaComorosCongo, Dem. Rep.Congo, Rep.Costa RicaCote d'IvoireCroatiaCubaCyprusCzech RepublicDenmarkDominicaDominican RepublicEarly-demographic dividendEast Asia & PacificEast Asia & Pacific (excluding high income)East Asia & Pacific (IDA & IBRD countries)EcuadorEgypt, Arab Rep.El SalvadorEquatorial GuineaEstoniaEthiopiaEuro areaEurope & Central AsiaEurope & Central Asia (excluding high income)Europe & Central Asia (IDA & IBRD countries)European UnionFijiFinlandFragile and conflict affected situationsFranceGabonGambia, TheGeorgiaGermanyGhanaGreeceGrenadaGuatemalaGuineaGuinea-BissauGuyanaHeavily indebted poor countries (HIPC)High incomeHondurasHong Kong SAR, ChinaHungaryIBRD onlyIcelandIDA & IBRD totalIDA blendIDA onlyIDA totalIndiaIndonesiaIran, Islamic Rep.IraqIrelandItalyJamaicaJapanJordanKazakhstanKenyaKiribatiKorea, Rep.KosovoKuwaitKyrgyz RepublicLao PDRLate-demographic dividendLatin America & Caribbean Latin America & Caribbean (excluding high income)Latin America & the Caribbean (IDA & IBRD countries)LatviaLeast developed countries: UN classificationLebanonLesothoLiberiaLiechtensteinLithuaniaLow & middle incomeLow incomeLower middle incomeLuxembourgMacao SAR, ChinaMacedonia, FYRMadagascarMalawiMalaysiaMaldivesMaliMaltaMarshall IslandsMauritaniaMauritiusMexicoMicronesia, Fed. Sts.Middle East & North AfricaMiddle East & North Africa (excluding high income)Middle East & North Africa (IDA & IBRD countries)Middle incomeMoldovaMongoliaMontenegroMoroccoMozambiqueMyanmarNamibiaNepalNetherlandsNew ZealandNicaraguaNigerNigeriaNorth AmericaNorwayOECD membersOmanOther small statesPacific island small statesPakistanPalauPanamaParaguayPeruPhilippinesPolandPortugalPost-demographic dividendPre-demographic dividendPuerto RicoQatarRomaniaRussian FederationRwandaSamoaSao Tome and PrincipeSaudi ArabiaSenegalSerbiaSeychellesSierra LeoneSingaporeSlovak RepublicSloveniaSmall statesSouth AfricaSouth AsiaSouth Asia (IDA & IBRD)SpainSri LankaSt. Kitts and NevisSt. LuciaSt. Vincent and the GrenadinesSub-Saharan Africa Sub-Saharan Africa (excluding high income)Sub-Saharan Africa (IDA & IBRD countries)SudanSurinameSwazilandSwedenSwitzerlandTajikistanTanzaniaThailandTimor-LesteTogoTongaTrinidad and TobagoTunisiaTurkeyTurkmenistanTuvaluUgandaUkraineUnited Arab EmiratesUnited KingdomUnited StatesUpper middle incomeUruguayUzbekistanVanuatuVenezuela, RBVietnamWest Bank and GazaWorldYemen, Rep.ZambiaZimbabwe Timeline:
This timeline shows a graph from 1991 to 2016 of World. No data until 1990. Number of actual observations by date: 26.
Source name:
World Development Indicators
Source organization:
World Bank national accounts data, and OECD National Accounts data files.
Categories, topics:
Economy & Growth
Last updated:
apr 23, 2017
Indicators value changes by year
Minimum:
11.352 trl
jan 1, 1991
Maximum:
20.908 trl
jan 1, 2016
At the date of observation
Value
Absolute change
Change from previous value
jan 1, 1991
11.352 trl
+11.352 trl
0.0%
jan 1, 1992
11.47 trl
+118.202 bln
1.04%
jan 1, 1993
11.426 trl
-44.196 bln
-0.39%
jan 1, 1994
11.394 trl
-32.091 bln
-0.28%
jan 1, 1995
11.57 trl
+176.082 bln
1.55%
jan 1, 1996
11.909 trl
+338.795 bln
2.93%
jan 1, 1997
12.226 trl
+317.314 bln
2.66%
jan 1, 1998
12.649 trl
+422.631 bln
3.46%
jan 1, 1999
12.846 trl
+196.917 bln
1.56%
jan 1, 2000
13.214 trl
+368.502 bln
2.87%
jan 1, 2001
13.848 trl
+633.911 bln
4.8%
jan 1, 2002
13.89 trl
+42.491 bln
0.31%
jan 1, 2003
14.088 trl
+197.996 bln
1.43%
jan 1, 2004
14.597 trl
+508.092 bln
3.61%
jan 1, 2005
15.426 trl
+829.501 bln
5.68%
jan 1, 2006
15.953 trl
+526.588 bln
3.41%
jan 1, 2007
16.796 trl
+843.32 bln
5.29%
jan 1, 2008
17.594 trl
+797.628 bln
4.75%
jan 1, 2009
17.791 trl
+197.853 bln
1.12%
jan 1, 2010
16.996 trl
-794.964 bln
-4.47%
jan 1, 2011
18.203 trl
+1.206 trl
7.1%
jan 1, 2012
18.769 trl
+565.873 bln
3.11%
jan 1, 2013
19.202 trl
+433.549 bln
2.31%
jan 1, 2014
19.673 trl
+471.065 bln
2.45%
jan 1, 2015
20.281 trl
+607.862 bln
3.09%
jan 1, 2016
20.908 trl
+626.745 bln
3.09%
Ranking of countries by current statistics by years


Comments: