29
/
en
AIzaSyAYiBZKx7MnpbEhh9jyipgxe19OcubqV5w
April 1, 2024
132131
Fiji
FJI
true
2
1
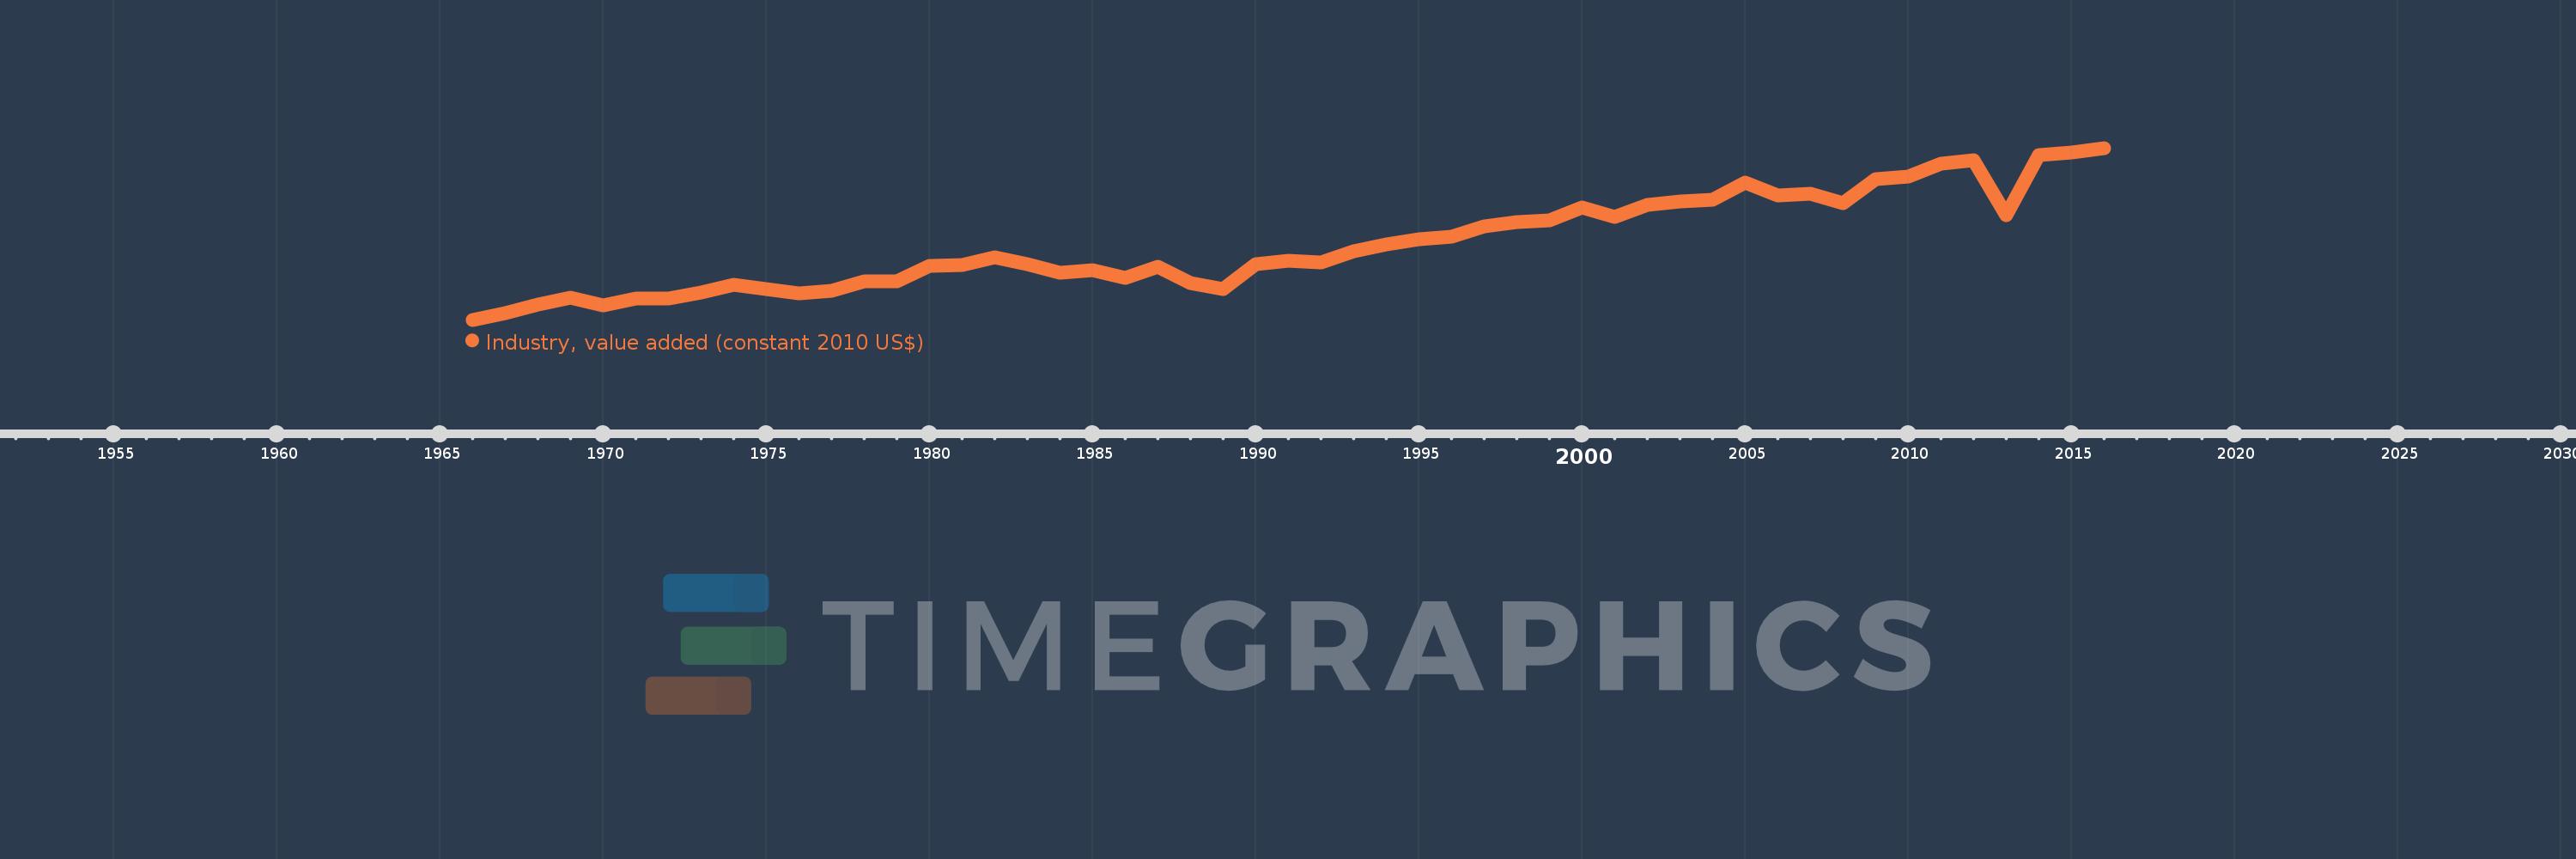
Industry, value added (constant 2010 US$)
2016,2015,2014,2013,2012,2011,2010,2009,2008,2007,2006,2005,2004,2003,2002,2001,2000,1999,1998,1997,1996,1995,1994,1993,1992,1991,1990,1989,1988,1987,1986,1985,1984,1983,1982,1981,1980,1979,1978,1977,1976,1975,1974,1973,1972,1971,1970,1969,1968,1967,1966
This statistics in other country:
AfghanistanAlbaniaAlgeriaAndorraAntigua and BarbudaArab WorldArgentinaArmeniaArubaAustraliaAustriaAzerbaijanBahamas, TheBahrainBangladeshBarbadosBelarusBelgiumBelizeBeninBermudaBhutanBoliviaBosnia and HerzegovinaBotswanaBrazilBrunei DarussalamBulgariaBurkina FasoBurundiCabo VerdeCambodiaCameroonCanadaCaribbean small statesCentral African RepublicCentral Europe and the BalticsChadChileChinaColombiaComorosCongo, Dem. Rep.Congo, Rep.Costa RicaCote d'IvoireCroatiaCubaCyprusCzech RepublicDenmarkDominicaDominican RepublicEarly-demographic dividendEast Asia & PacificEast Asia & Pacific (excluding high income)East Asia & Pacific (IDA & IBRD countries)EcuadorEgypt, Arab Rep.El SalvadorEquatorial GuineaEstoniaEthiopiaEuro areaEurope & Central AsiaEurope & Central Asia (excluding high income)Europe & Central Asia (IDA & IBRD countries)European UnionFijiFinlandFragile and conflict affected situationsFranceGabonGambia, TheGeorgiaGermanyGhanaGreeceGrenadaGuatemalaGuineaGuinea-BissauGuyanaHeavily indebted poor countries (HIPC)High incomeHondurasHong Kong SAR, ChinaHungaryIBRD onlyIcelandIDA & IBRD totalIDA blendIDA onlyIDA totalIndiaIndonesiaIran, Islamic Rep.IraqIrelandItalyJamaicaJapanJordanKazakhstanKenyaKiribatiKorea, Rep.KosovoKuwaitKyrgyz RepublicLao PDRLate-demographic dividendLatin America & Caribbean Latin America & Caribbean (excluding high income)Latin America & the Caribbean (IDA & IBRD countries)LatviaLeast developed countries: UN classificationLebanonLesothoLiberiaLiechtensteinLithuaniaLow & middle incomeLow incomeLower middle incomeLuxembourgMacao SAR, ChinaMacedonia, FYRMadagascarMalawiMalaysiaMaldivesMaliMaltaMarshall IslandsMauritaniaMauritiusMexicoMicronesia, Fed. Sts.Middle East & North AfricaMiddle East & North Africa (excluding high income)Middle East & North Africa (IDA & IBRD countries)Middle incomeMoldovaMongoliaMontenegroMoroccoMozambiqueMyanmarNamibiaNepalNetherlandsNew ZealandNicaraguaNigerNigeriaNorth AmericaNorwayOECD membersOmanOther small statesPacific island small statesPakistanPalauPanamaParaguayPeruPhilippinesPolandPortugalPost-demographic dividendPre-demographic dividendPuerto RicoQatarRomaniaRussian FederationRwandaSamoaSao Tome and PrincipeSaudi ArabiaSenegalSerbiaSeychellesSierra LeoneSingaporeSlovak RepublicSloveniaSmall statesSouth AfricaSouth AsiaSouth Asia (IDA & IBRD)SpainSri LankaSt. Kitts and NevisSt. LuciaSt. Vincent and the GrenadinesSub-Saharan Africa Sub-Saharan Africa (excluding high income)Sub-Saharan Africa (IDA & IBRD countries)SudanSurinameSwazilandSwedenSwitzerlandTajikistanTanzaniaThailandTimor-LesteTogoTongaTrinidad and TobagoTunisiaTurkeyTurkmenistanTuvaluUgandaUkraineUnited Arab EmiratesUnited KingdomUnited StatesUpper middle incomeUruguayUzbekistanVanuatuVenezuela, RBVietnamWest Bank and GazaWorldYemen, Rep.ZambiaZimbabwe Timeline:
This timeline shows a graph from 1966 to 2016 of Fiji. No data until 1965. Number of actual observations by date: 51.
Source name:
World Development Indicators
Source organization:
World Bank national accounts data, and OECD National Accounts data files.
Categories, topics:
Economy & Growth
Last updated:
apr 23, 2017
Indicators value changes by year
Minimum:
139.516 mln
jan 1, 1966
Maximum:
573.649 mln
jan 1, 2016
At the date of observation
Value
Absolute change
Change from previous value
jan 1, 1966
139.516 mln
+139.516 mln
0.0%
jan 1, 1967
157.092 mln
+17.576 mln
12.6%
jan 1, 1968
177.756 mln
+20.664 mln
13.15%
jan 1, 1969
195.172 mln
+17.416 mln
9.8%
jan 1, 1970
175.863 mln
-19.309 mln
-9.89%
jan 1, 1971
192.9 mln
+17.037 mln
9.69%
jan 1, 1972
192.9 mln
0.0
0.0%
jan 1, 1973
207.476 mln
+14.576 mln
7.56%
jan 1, 1974
227.164 mln
+19.688 mln
9.49%
jan 1, 1975
217.509 mln
-9.654 mln
-4.25%
jan 1, 1976
207.098 mln
-10.412 mln
-4.79%
jan 1, 1977
213.534 mln
+6.436 mln
3.11%
jan 1, 1978
237.386 mln
+23.852 mln
11.17%
jan 1, 1979
237.197 mln
-189.304K
-0.08%
jan 1, 1980
275.057 mln
+37.861 mln
15.96%
jan 1, 1981
278.844 mln
+3.786 mln
1.38%
jan 1, 1982
296.449 mln
+17.605 mln
6.31%
jan 1, 1983
279.033 mln
-17.416 mln
-5.87%
jan 1, 1984
258.588 mln
-20.445 mln
-7.33%
jan 1, 1985
264.078 mln
+5.49 mln
2.12%
jan 1, 1986
245.905 mln
-18.173 mln
-6.88%
jan 1, 1987
274.3 mln
+28.395 mln
11.55%
jan 1, 1988
233.032 mln
-41.268 mln
-15.04%
jan 1, 1989
217.888 mln
-15.144 mln
-6.5%
jan 1, 1990
280.392 mln
+62.504 mln
28.69%
jan 1, 1991
288.944 mln
+8.552 mln
3.05%
jan 1, 1992
284.357 mln
-4.587 mln
-1.59%
jan 1, 1993
313.286 mln
+28.93 mln
10.17%
jan 1, 1994
330.641 mln
+17.355 mln
5.54%
jan 1, 1995
343.657 mln
+13.016 mln
3.94%
jan 1, 1996
349.567 mln
+5.91 mln
1.72%
jan 1, 1997
375.454 mln
+25.887 mln
7.41%
jan 1, 1998
386.847 mln
+11.392 mln
3.03%
jan 1, 1999
391.512 mln
+4.666 mln
1.21%
jan 1, 2000
423.083 mln
+31.571 mln
8.06%
jan 1, 2001
400.056 mln
-23.027 mln
-5.44%
jan 1, 2002
429.143 mln
+29.086 mln
7.27%
jan 1, 2003
438.838 mln
+9.695 mln
2.26%
jan 1, 2004
442.534 mln
+3.696 mln
0.84%
jan 1, 2005
486.891 mln
+44.356 mln
10.02%
jan 1, 2006
454.593 mln
-32.298 mln
-6.63%
jan 1, 2007
457.608 mln
+3.015 mln
0.66%
jan 1, 2008
434.034 mln
-23.574 mln
-5.15%
jan 1, 2009
495.172 mln
+61.138 mln
14.09%
jan 1, 2010
500.337 mln
+5.164 mln
1.04%
jan 1, 2011
533.025 mln
+32.689 mln
6.53%
jan 1, 2012
543.602 mln
+10.577 mln
1.98%
jan 1, 2013
404.245 mln
-139.358 mln
-25.64%
jan 1, 2014
554.926 mln
+150.681 mln
37.27%
jan 1, 2015
561.469 mln
+6.543 mln
1.18%
jan 1, 2016
573.649 mln
+12.179 mln
2.17%
Ranking of countries by current statistics by years


Comments: