29
/
en
AIzaSyAYiBZKx7MnpbEhh9jyipgxe19OcubqV5w
April 1, 2024
89955
Botswana
BWA
true
2
1
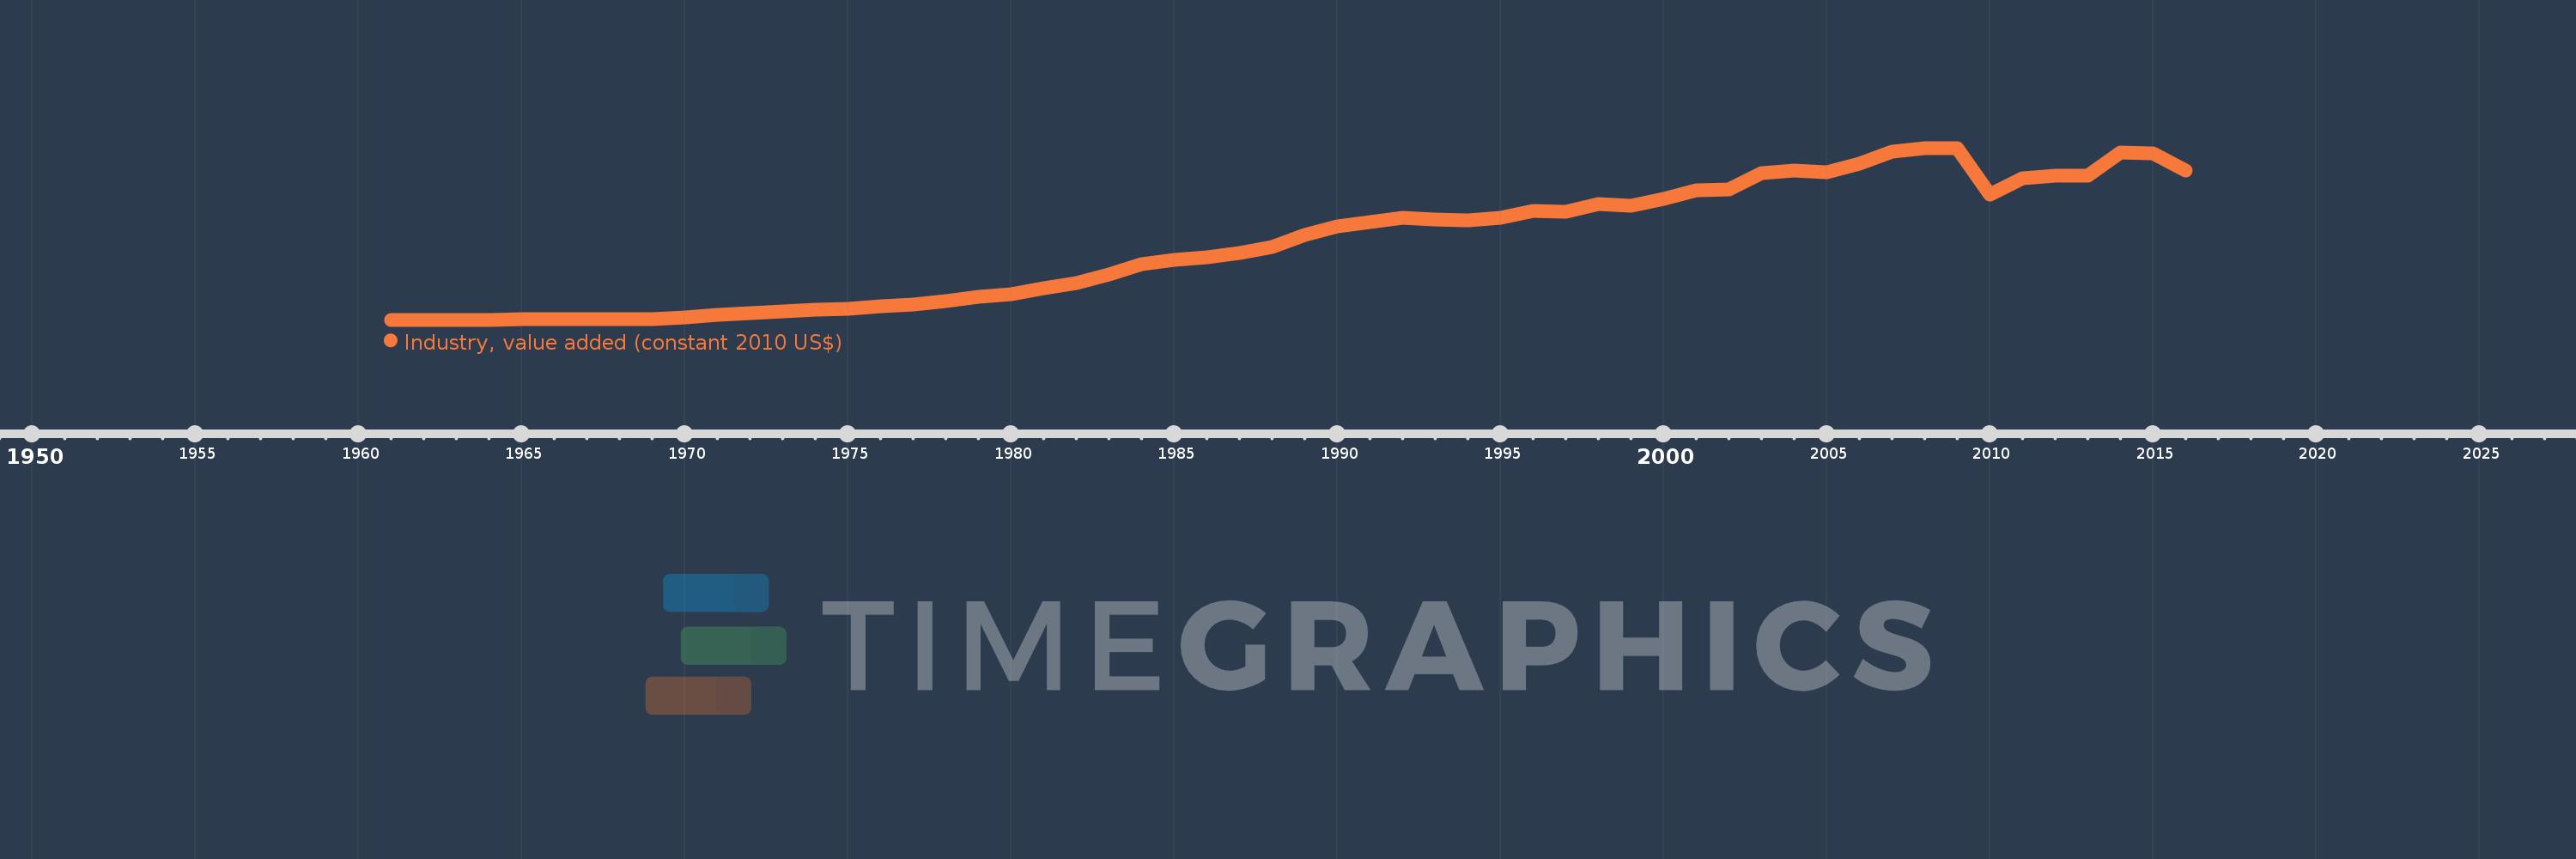
Industry, value added (constant 2010 US$)
2016,2015,2014,2013,2012,2011,2010,2009,2008,2007,2006,2005,2004,2003,2002,2001,2000,1999,1998,1997,1996,1995,1994,1993,1992,1991,1990,1989,1988,1987,1986,1985,1984,1983,1982,1981,1980,1979,1978,1977,1976,1975,1974,1973,1972,1971,1970,1969,1968,1967,1966,1965,1964,1963,1962,1961
This statistics in other country:
AfghanistanAlbaniaAlgeriaAndorraAntigua and BarbudaArab WorldArgentinaArmeniaArubaAustraliaAustriaAzerbaijanBahamas, TheBahrainBangladeshBarbadosBelarusBelgiumBelizeBeninBermudaBhutanBoliviaBosnia and HerzegovinaBotswanaBrazilBrunei DarussalamBulgariaBurkina FasoBurundiCabo VerdeCambodiaCameroonCanadaCaribbean small statesCentral African RepublicCentral Europe and the BalticsChadChileChinaColombiaComorosCongo, Dem. Rep.Congo, Rep.Costa RicaCote d'IvoireCroatiaCubaCyprusCzech RepublicDenmarkDominicaDominican RepublicEarly-demographic dividendEast Asia & PacificEast Asia & Pacific (excluding high income)East Asia & Pacific (IDA & IBRD countries)EcuadorEgypt, Arab Rep.El SalvadorEquatorial GuineaEstoniaEthiopiaEuro areaEurope & Central AsiaEurope & Central Asia (excluding high income)Europe & Central Asia (IDA & IBRD countries)European UnionFijiFinlandFragile and conflict affected situationsFranceGabonGambia, TheGeorgiaGermanyGhanaGreeceGrenadaGuatemalaGuineaGuinea-BissauGuyanaHeavily indebted poor countries (HIPC)High incomeHondurasHong Kong SAR, ChinaHungaryIBRD onlyIcelandIDA & IBRD totalIDA blendIDA onlyIDA totalIndiaIndonesiaIran, Islamic Rep.IraqIrelandItalyJamaicaJapanJordanKazakhstanKenyaKiribatiKorea, Rep.KosovoKuwaitKyrgyz RepublicLao PDRLate-demographic dividendLatin America & Caribbean Latin America & Caribbean (excluding high income)Latin America & the Caribbean (IDA & IBRD countries)LatviaLeast developed countries: UN classificationLebanonLesothoLiberiaLiechtensteinLithuaniaLow & middle incomeLow incomeLower middle incomeLuxembourgMacao SAR, ChinaMacedonia, FYRMadagascarMalawiMalaysiaMaldivesMaliMaltaMarshall IslandsMauritaniaMauritiusMexicoMicronesia, Fed. Sts.Middle East & North AfricaMiddle East & North Africa (excluding high income)Middle East & North Africa (IDA & IBRD countries)Middle incomeMoldovaMongoliaMontenegroMoroccoMozambiqueMyanmarNamibiaNepalNetherlandsNew ZealandNicaraguaNigerNigeriaNorth AmericaNorwayOECD membersOmanOther small statesPacific island small statesPakistanPalauPanamaParaguayPeruPhilippinesPolandPortugalPost-demographic dividendPre-demographic dividendPuerto RicoQatarRomaniaRussian FederationRwandaSamoaSao Tome and PrincipeSaudi ArabiaSenegalSerbiaSeychellesSierra LeoneSingaporeSlovak RepublicSloveniaSmall statesSouth AfricaSouth AsiaSouth Asia (IDA & IBRD)SpainSri LankaSt. Kitts and NevisSt. LuciaSt. Vincent and the GrenadinesSub-Saharan Africa Sub-Saharan Africa (excluding high income)Sub-Saharan Africa (IDA & IBRD countries)SudanSurinameSwazilandSwedenSwitzerlandTajikistanTanzaniaThailandTimor-LesteTogoTongaTrinidad and TobagoTunisiaTurkeyTurkmenistanTuvaluUgandaUkraineUnited Arab EmiratesUnited KingdomUnited StatesUpper middle incomeUruguayUzbekistanVanuatuVenezuela, RBVietnamWest Bank and GazaWorldYemen, Rep.ZambiaZimbabwe Timeline:
This timeline shows a graph from 1961 to 2016 of Botswana. No data until 1960. Number of actual observations by date: 56.
Source name:
World Development Indicators
Source organization:
World Bank national accounts data, and OECD National Accounts data files.
Categories, topics:
Economy & Growth
Last updated:
apr 23, 2017
Indicators value changes by year
Minimum:
19.326 mln
jan 1, 1964
Maximum:
4.935 bln
jan 1, 2009
At the date of observation
Value
Absolute change
Change from previous value
jan 1, 1961
20.667 mln
+20.667 mln
0.0%
jan 1, 1962
20.22 mln
-446.848K
-2.16%
jan 1, 1963
20.89 mln
+670.272K
3.31%
jan 1, 1964
19.326 mln
-1.564 mln
-7.49%
jan 1, 1965
29.003 mln
+9.677 mln
50.07%
jan 1, 1966
48.14 mln
+19.136 mln
65.98%
jan 1, 1967
45.985 mln
-2.154 mln
-4.48%
jan 1, 1968
48.643 mln
+2.658 mln
5.78%
jan 1, 1969
44.605 mln
-4.038 mln
-8.3%
jan 1, 1970
95.472 mln
+50.866 mln
114.04%
jan 1, 1971
162.79 mln
+67.318 mln
70.51%
jan 1, 1972
201.393 mln
+38.604 mln
23.71%
jan 1, 1973
254.513 mln
+53.119 mln
26.38%
jan 1, 1974
308.575 mln
+54.062 mln
21.24%
jan 1, 1975
336.333 mln
+27.758 mln
9.0%
jan 1, 1976
405.172 mln
+68.839 mln
20.47%
jan 1, 1977
458.321 mln
+53.149 mln
13.12%
jan 1, 1978
561.041 mln
+102.719 mln
22.41%
jan 1, 1979
677.973 mln
+116.932 mln
20.84%
jan 1, 1980
750.776 mln
+72.803 mln
10.74%
jan 1, 1981
910.969 mln
+160.194 mln
21.34%
jan 1, 1982
1.071 bln
+160.169 mln
17.58%
jan 1, 1983
1.311 bln
+239.689 mln
22.38%
jan 1, 1984
1.606 bln
+294.853 mln
22.49%
jan 1, 1985
1.739 bln
+133.811 mln
8.33%
jan 1, 1986
1.8 bln
+60.901 mln
3.5%
jan 1, 1987
1.929 bln
+128.316 mln
7.13%
jan 1, 1988
2.096 bln
+167.551 mln
8.69%
jan 1, 1989
2.439 bln
+342.928 mln
16.36%
jan 1, 1990
2.698 bln
+258.428 mln
10.59%
jan 1, 1991
2.802 bln
+104.63 mln
3.88%
jan 1, 1992
2.931 bln
+129.251 mln
4.61%
jan 1, 1993
2.878 bln
-53.376 mln
-1.82%
jan 1, 1994
2.854 bln
-24.085 mln
-0.84%
jan 1, 1995
2.927 bln
+72.857 mln
2.55%
jan 1, 1996
3.136 bln
+208.828 mln
7.13%
jan 1, 1997
3.115 bln
-20.656 mln
-0.66%
jan 1, 1998
3.32 bln
+204.776 mln
6.57%
jan 1, 1999
3.269 bln
-50.636 mln
-1.53%
jan 1, 2000
3.487 bln
+218.096 mln
6.67%
jan 1, 2001
3.725 bln
+237.326 mln
6.81%
jan 1, 2002
3.74 bln
+15.121 mln
0.41%
jan 1, 2003
4.217 bln
+476.903 mln
12.75%
jan 1, 2004
4.294 bln
+77.407 mln
1.84%
jan 1, 2005
4.245 bln
-49.302 mln
-1.15%
jan 1, 2006
4.484 bln
+239.267 mln
5.64%
jan 1, 2007
4.834 bln
+349.753 mln
7.8%
jan 1, 2008
4.931 bln
+97.087 mln
2.01%
jan 1, 2009
4.935 bln
+4.301 mln
0.09%
jan 1, 2010
3.601 bln
-1.334 bln
-27.03%
jan 1, 2011
4.074 bln
+472.807 mln
13.13%
jan 1, 2012
4.133 bln
+59.411 mln
1.46%
jan 1, 2013
4.146 bln
+12.46 mln
0.3%
jan 1, 2014
4.815 bln
+668.635 mln
16.13%
jan 1, 2015
4.792 bln
-22.487 mln
-0.47%
jan 1, 2016
4.284 bln
-508.478 mln
-10.61%
Ranking of countries by current statistics by years


Comments: