29
/
en
AIzaSyAYiBZKx7MnpbEhh9jyipgxe19OcubqV5w
April 1, 2024
166297
Kazakhstan
KAZ
true
2
1
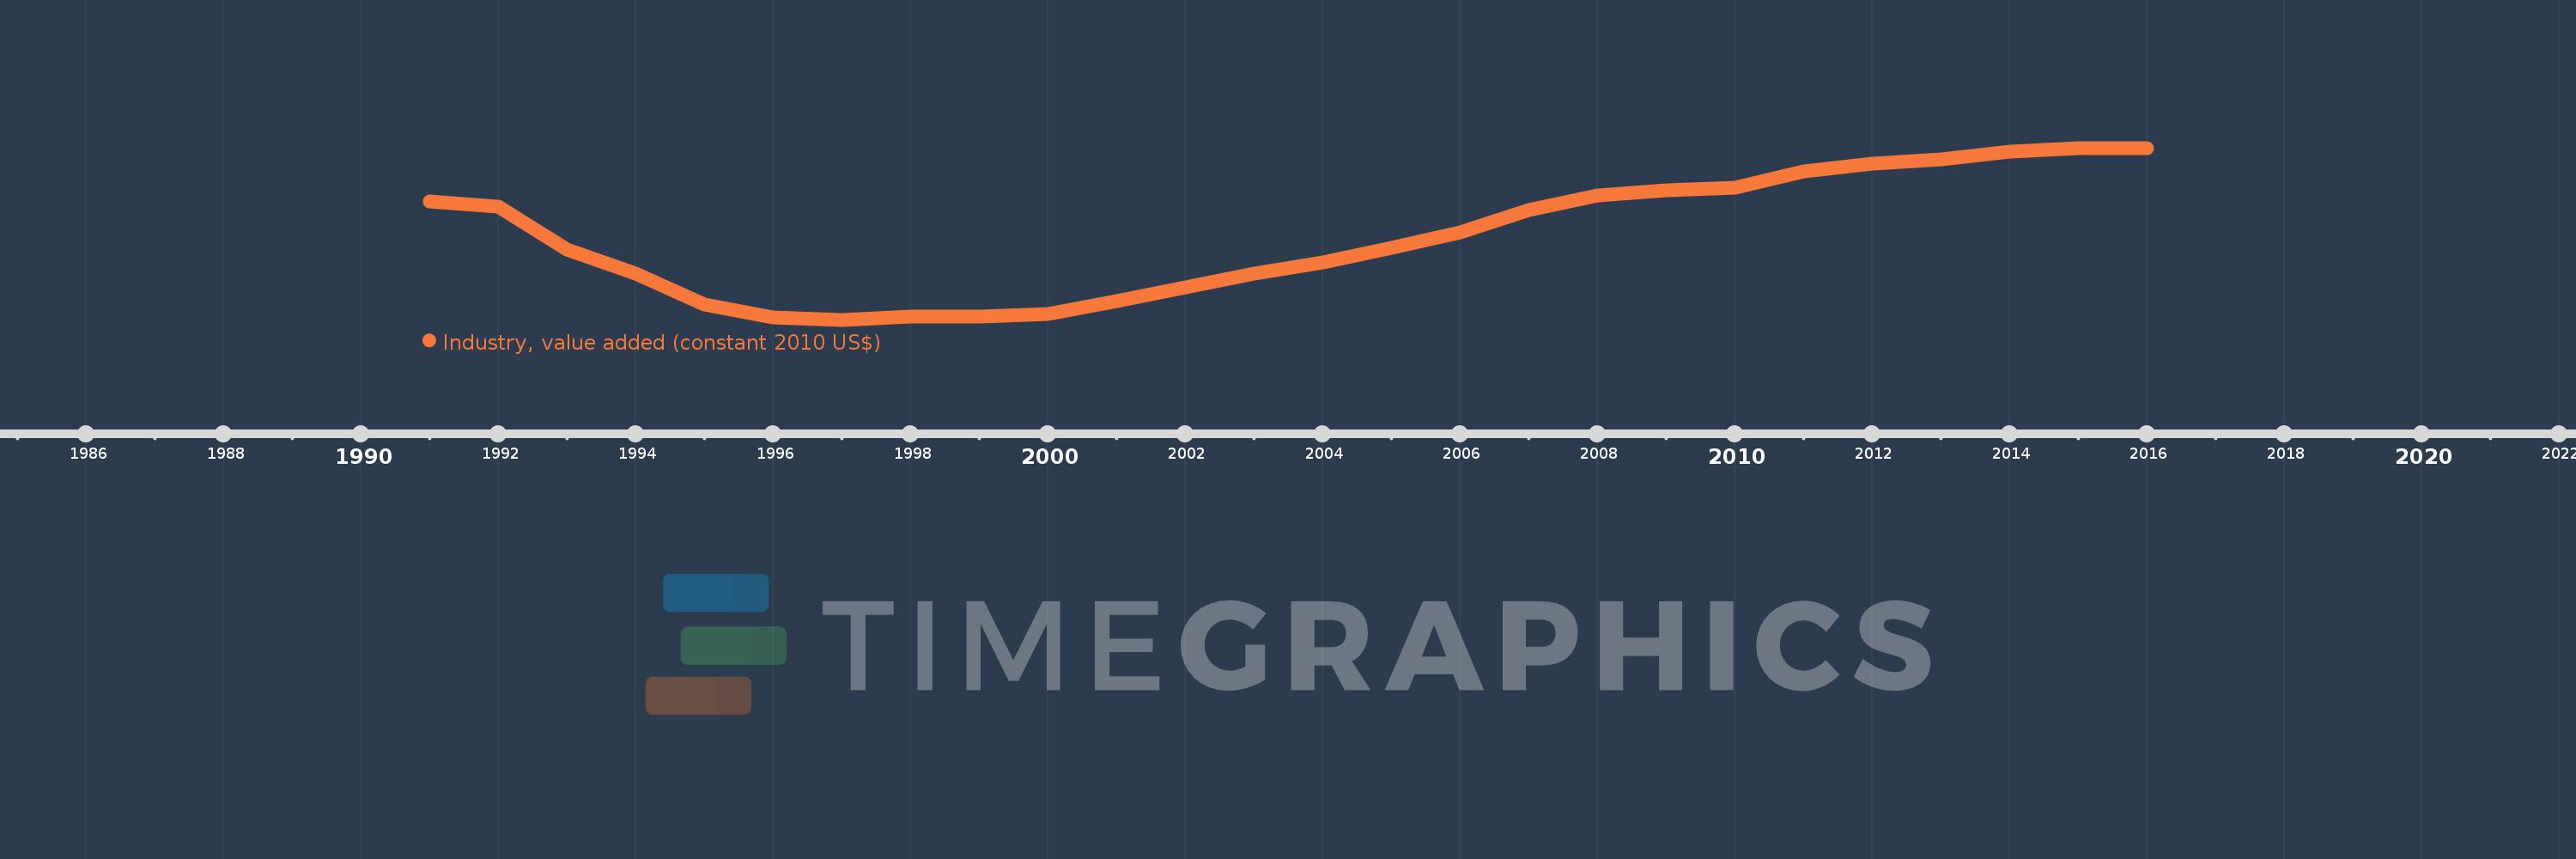
Industry, value added (constant 2010 US$)
2016,2015,2014,2013,2012,2011,2010,2009,2008,2007,2006,2005,2004,2003,2002,2001,2000,1999,1998,1997,1996,1995,1994,1993,1992,1991
This statistics in other country:
AfghanistanAlbaniaAlgeriaAndorraAntigua and BarbudaArab WorldArgentinaArmeniaArubaAustraliaAustriaAzerbaijanBahamas, TheBahrainBangladeshBarbadosBelarusBelgiumBelizeBeninBermudaBhutanBoliviaBosnia and HerzegovinaBotswanaBrazilBrunei DarussalamBulgariaBurkina FasoBurundiCabo VerdeCambodiaCameroonCanadaCaribbean small statesCentral African RepublicCentral Europe and the BalticsChadChileChinaColombiaComorosCongo, Dem. Rep.Congo, Rep.Costa RicaCote d'IvoireCroatiaCubaCyprusCzech RepublicDenmarkDominicaDominican RepublicEarly-demographic dividendEast Asia & PacificEast Asia & Pacific (excluding high income)East Asia & Pacific (IDA & IBRD countries)EcuadorEgypt, Arab Rep.El SalvadorEquatorial GuineaEstoniaEthiopiaEuro areaEurope & Central AsiaEurope & Central Asia (excluding high income)Europe & Central Asia (IDA & IBRD countries)European UnionFijiFinlandFragile and conflict affected situationsFranceGabonGambia, TheGeorgiaGermanyGhanaGreeceGrenadaGuatemalaGuineaGuinea-BissauGuyanaHeavily indebted poor countries (HIPC)High incomeHondurasHong Kong SAR, ChinaHungaryIBRD onlyIcelandIDA & IBRD totalIDA blendIDA onlyIDA totalIndiaIndonesiaIran, Islamic Rep.IraqIrelandItalyJamaicaJapanJordanKazakhstanKenyaKiribatiKorea, Rep.KosovoKuwaitKyrgyz RepublicLao PDRLate-demographic dividendLatin America & Caribbean Latin America & Caribbean (excluding high income)Latin America & the Caribbean (IDA & IBRD countries)LatviaLeast developed countries: UN classificationLebanonLesothoLiberiaLiechtensteinLithuaniaLow & middle incomeLow incomeLower middle incomeLuxembourgMacao SAR, ChinaMacedonia, FYRMadagascarMalawiMalaysiaMaldivesMaliMaltaMarshall IslandsMauritaniaMauritiusMexicoMicronesia, Fed. Sts.Middle East & North AfricaMiddle East & North Africa (excluding high income)Middle East & North Africa (IDA & IBRD countries)Middle incomeMoldovaMongoliaMontenegroMoroccoMozambiqueMyanmarNamibiaNepalNetherlandsNew ZealandNicaraguaNigerNigeriaNorth AmericaNorwayOECD membersOmanOther small statesPacific island small statesPakistanPalauPanamaParaguayPeruPhilippinesPolandPortugalPost-demographic dividendPre-demographic dividendPuerto RicoQatarRomaniaRussian FederationRwandaSamoaSao Tome and PrincipeSaudi ArabiaSenegalSerbiaSeychellesSierra LeoneSingaporeSlovak RepublicSloveniaSmall statesSouth AfricaSouth AsiaSouth Asia (IDA & IBRD)SpainSri LankaSt. Kitts and NevisSt. LuciaSt. Vincent and the GrenadinesSub-Saharan Africa Sub-Saharan Africa (excluding high income)Sub-Saharan Africa (IDA & IBRD countries)SudanSurinameSwazilandSwedenSwitzerlandTajikistanTanzaniaThailandTimor-LesteTogoTongaTrinidad and TobagoTunisiaTurkeyTurkmenistanTuvaluUgandaUkraineUnited Arab EmiratesUnited KingdomUnited StatesUpper middle incomeUruguayUzbekistanVanuatuVenezuela, RBVietnamWest Bank and GazaWorldYemen, Rep.ZambiaZimbabwe Timeline:
This timeline shows a graph from 1991 to 2016 of Kazakhstan. No data until 1990. Number of actual observations by date: 26.
Source name:
World Development Indicators
Source organization:
World Bank national accounts data, and OECD National Accounts data files.
Categories, topics:
Economy & Growth
Last updated:
apr 23, 2017
Indicators value changes by year
Minimum:
20.279 bln
jan 1, 1997
Maximum:
66.329 bln
jan 1, 2015
At the date of observation
Value
Absolute change
Change from previous value
jan 1, 1991
52.048 bln
+52.048 bln
0.0%
jan 1, 1992
50.628 bln
-1.421 bln
-2.73%
jan 1, 1993
39.024 bln
-11.604 bln
-22.92%
jan 1, 1994
32.669 bln
-6.355 bln
-16.28%
jan 1, 1995
24.312 bln
-8.357 bln
-25.58%
jan 1, 1996
20.854 bln
-3.459 bln
-14.23%
jan 1, 1997
20.279 bln
-574.855 mln
-2.76%
jan 1, 1998
21.198 bln
+919.402 mln
4.53%
jan 1, 1999
21.113 bln
-84.913 mln
-0.4%
jan 1, 2000
21.832 bln
+718.533 mln
3.4%
jan 1, 2001
25.171 bln
+3.339 bln
15.29%
jan 1, 2002
29.048 bln
+3.878 bln
15.41%
jan 1, 2003
32.54 bln
+3.491 bln
12.02%
jan 1, 2004
35.542 bln
+3.003 bln
9.23%
jan 1, 2005
39.541 bln
+3.999 bln
11.25%
jan 1, 2006
43.76 bln
+4.219 bln
10.67%
jan 1, 2007
49.607 bln
+5.847 bln
13.36%
jan 1, 2008
53.567 bln
+3.96 bln
7.98%
jan 1, 2009
54.929 bln
+1.362 bln
2.54%
jan 1, 2010
55.759 bln
+830.072 mln
1.51%
jan 1, 2011
60.111 bln
+4.352 bln
7.8%
jan 1, 2012
62.229 bln
+2.119 bln
3.52%
jan 1, 2013
63.356 bln
+1.126 bln
1.81%
jan 1, 2014
65.318 bln
+1.963 bln
3.1%
jan 1, 2015
66.329 bln
+1.011 bln
1.55%
jan 1, 2016
66.181 bln
-148.739 mln
-0.22%
Ranking of countries by current statistics by years


Comments: