29
/
en
AIzaSyAYiBZKx7MnpbEhh9jyipgxe19OcubqV5w
April 1, 2024
44347
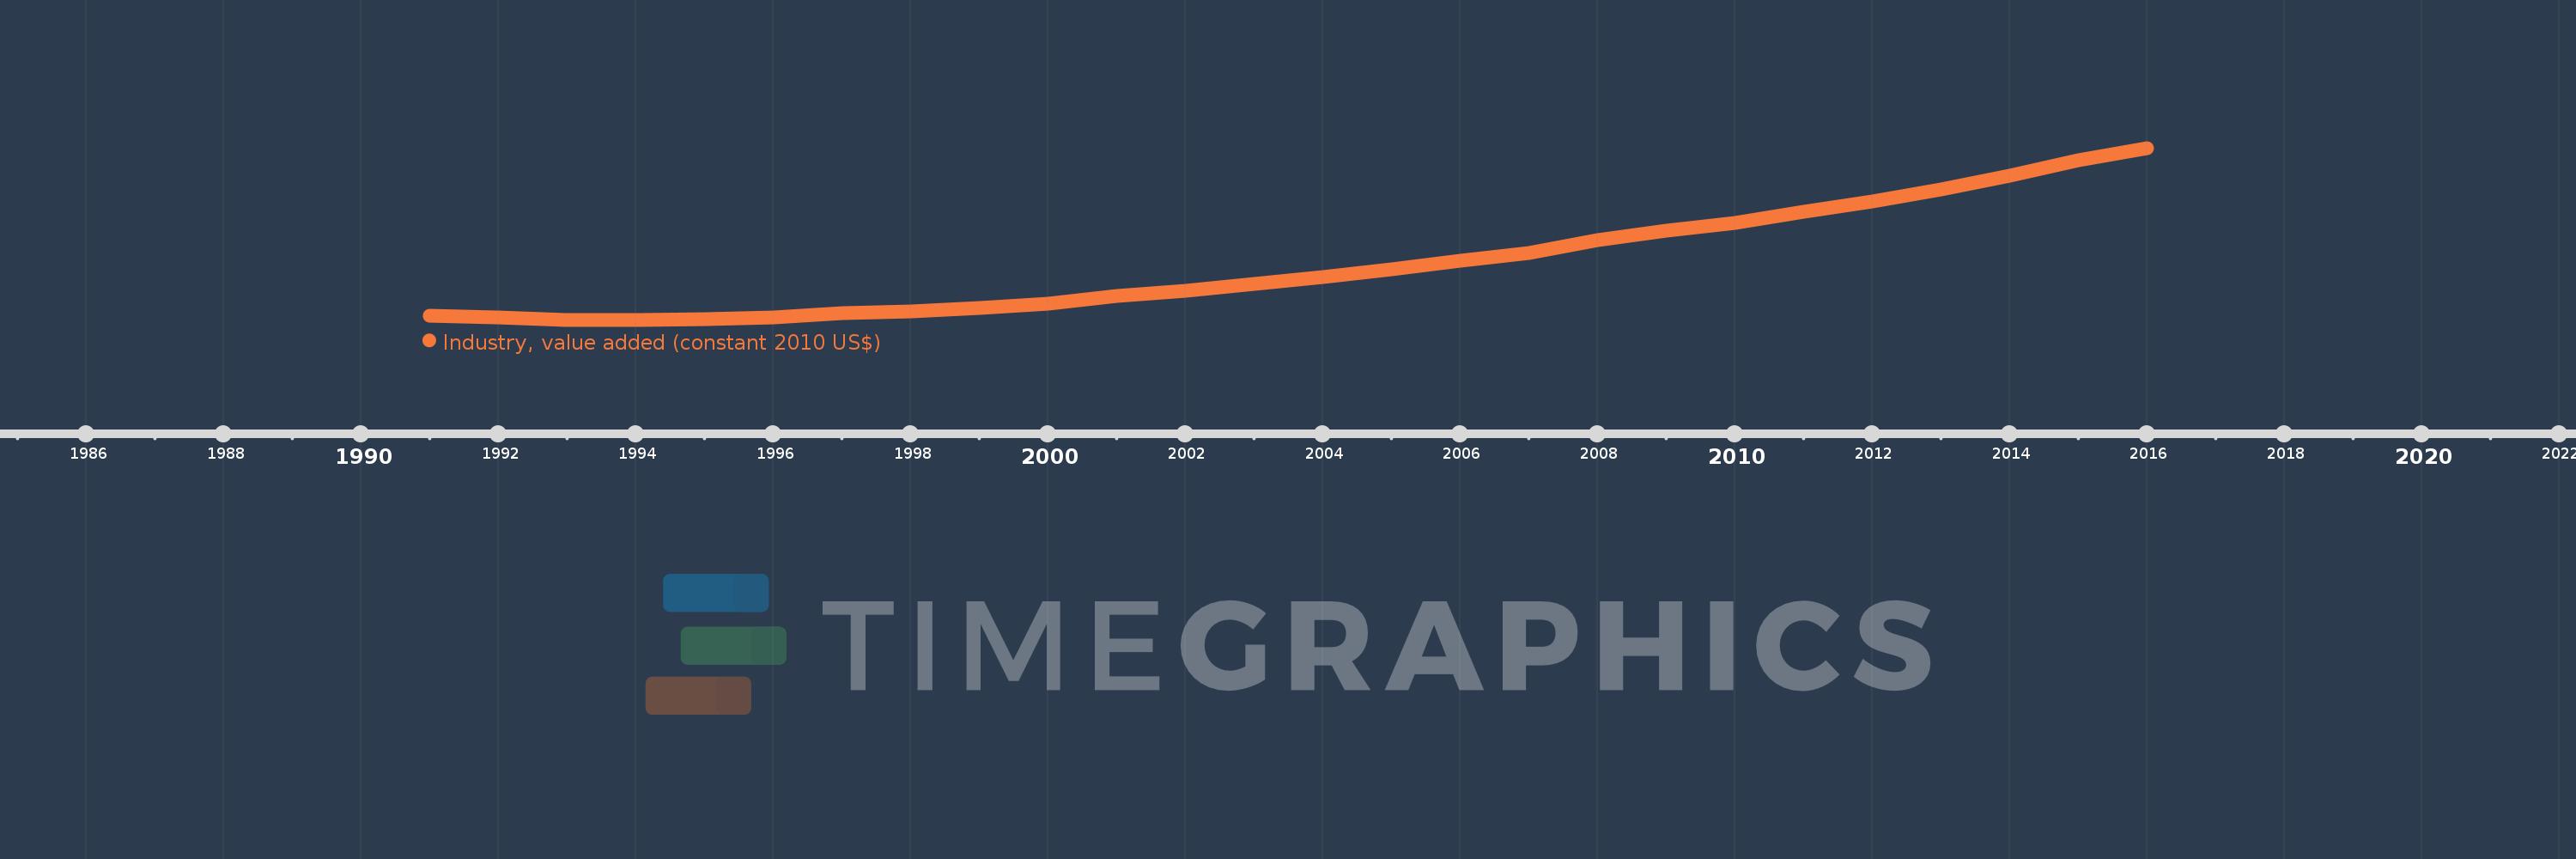
Least developed countries: UN classification
LDC
false
2
1
Industry, value added (constant 2010 US$)
2016,2015,2014,2013,2012,2011,2010,2009,2008,2007,2006,2005,2004,2003,2002,2001,2000,1999,1998,1997,1996,1995,1994,1993,1992,1991
This statistics in other country:
AfghanistanAlbaniaAlgeriaAndorraAntigua and BarbudaArab WorldArgentinaArmeniaArubaAustraliaAustriaAzerbaijanBahamas, TheBahrainBangladeshBarbadosBelarusBelgiumBelizeBeninBermudaBhutanBoliviaBosnia and HerzegovinaBotswanaBrazilBrunei DarussalamBulgariaBurkina FasoBurundiCabo VerdeCambodiaCameroonCanadaCaribbean small statesCentral African RepublicCentral Europe and the BalticsChadChileChinaColombiaComorosCongo, Dem. Rep.Congo, Rep.Costa RicaCote d'IvoireCroatiaCubaCyprusCzech RepublicDenmarkDominicaDominican RepublicEarly-demographic dividendEast Asia & PacificEast Asia & Pacific (excluding high income)East Asia & Pacific (IDA & IBRD countries)EcuadorEgypt, Arab Rep.El SalvadorEquatorial GuineaEstoniaEthiopiaEuro areaEurope & Central AsiaEurope & Central Asia (excluding high income)Europe & Central Asia (IDA & IBRD countries)European UnionFijiFinlandFragile and conflict affected situationsFranceGabonGambia, TheGeorgiaGermanyGhanaGreeceGrenadaGuatemalaGuineaGuinea-BissauGuyanaHeavily indebted poor countries (HIPC)High incomeHondurasHong Kong SAR, ChinaHungaryIBRD onlyIcelandIDA & IBRD totalIDA blendIDA onlyIDA totalIndiaIndonesiaIran, Islamic Rep.IraqIrelandItalyJamaicaJapanJordanKazakhstanKenyaKiribatiKorea, Rep.KosovoKuwaitKyrgyz RepublicLao PDRLate-demographic dividendLatin America & Caribbean Latin America & Caribbean (excluding high income)Latin America & the Caribbean (IDA & IBRD countries)LatviaLeast developed countries: UN classificationLebanonLesothoLiberiaLiechtensteinLithuaniaLow & middle incomeLow incomeLower middle incomeLuxembourgMacao SAR, ChinaMacedonia, FYRMadagascarMalawiMalaysiaMaldivesMaliMaltaMarshall IslandsMauritaniaMauritiusMexicoMicronesia, Fed. Sts.Middle East & North AfricaMiddle East & North Africa (excluding high income)Middle East & North Africa (IDA & IBRD countries)Middle incomeMoldovaMongoliaMontenegroMoroccoMozambiqueMyanmarNamibiaNepalNetherlandsNew ZealandNicaraguaNigerNigeriaNorth AmericaNorwayOECD membersOmanOther small statesPacific island small statesPakistanPalauPanamaParaguayPeruPhilippinesPolandPortugalPost-demographic dividendPre-demographic dividendPuerto RicoQatarRomaniaRussian FederationRwandaSamoaSao Tome and PrincipeSaudi ArabiaSenegalSerbiaSeychellesSierra LeoneSingaporeSlovak RepublicSloveniaSmall statesSouth AfricaSouth AsiaSouth Asia (IDA & IBRD)SpainSri LankaSt. Kitts and NevisSt. LuciaSt. Vincent and the GrenadinesSub-Saharan Africa Sub-Saharan Africa (excluding high income)Sub-Saharan Africa (IDA & IBRD countries)SudanSurinameSwazilandSwedenSwitzerlandTajikistanTanzaniaThailandTimor-LesteTogoTongaTrinidad and TobagoTunisiaTurkeyTurkmenistanTuvaluUgandaUkraineUnited Arab EmiratesUnited KingdomUnited StatesUpper middle incomeUruguayUzbekistanVanuatuVenezuela, RBVietnamWest Bank and GazaWorldYemen, Rep.ZambiaZimbabwe Timeline:
This timeline shows a graph from 1991 to 2016 of Least developed countries: UN classification. No data until 1990. Number of actual observations by date: 26.
Source name:
World Development Indicators
Source organization:
World Bank national accounts data, and OECD National Accounts data files.
Categories, topics:
Economy & Growth
Last updated:
apr 23, 2017
Indicators value changes by year
Minimum:
65.777 bln
jan 1, 1994
Maximum:
280.286 bln
jan 1, 2016
At the date of observation
Value
Absolute change
Change from previous value
jan 1, 1991
70.831 bln
+70.831 bln
0.0%
jan 1, 1992
68.674 bln
-2.157 bln
-3.05%
jan 1, 1993
65.877 bln
-2.797 bln
-4.07%
jan 1, 1994
65.777 bln
-99.746 mln
-0.15%
jan 1, 1995
66.354 bln
+576.616 mln
0.88%
jan 1, 1996
68.549 bln
+2.195 bln
3.31%
jan 1, 1997
73.568 bln
+5.019 bln
7.32%
jan 1, 1998
76.12 bln
+2.552 bln
3.47%
jan 1, 1999
80.154 bln
+4.034 bln
5.3%
jan 1, 2000
85.472 bln
+5.317 bln
6.63%
jan 1, 2001
95.652 bln
+10.181 bln
11.91%
jan 1, 2002
101.969 bln
+6.317 bln
6.6%
jan 1, 2003
110.382 bln
+8.413 bln
8.25%
jan 1, 2004
119.343 bln
+8.961 bln
8.12%
jan 1, 2005
128.839 bln
+9.497 bln
7.96%
jan 1, 2006
139.241 bln
+10.402 bln
8.07%
jan 1, 2007
149.437 bln
+10.195 bln
7.32%
jan 1, 2008
165.681 bln
+16.244 bln
10.87%
jan 1, 2009
176.504 bln
+10.823 bln
6.53%
jan 1, 2010
187.138 bln
+10.634 bln
6.02%
jan 1, 2011
200.513 bln
+13.375 bln
7.15%
jan 1, 2012
213.266 bln
+12.753 bln
6.36%
jan 1, 2013
228.801 bln
+15.534 bln
7.28%
jan 1, 2014
245.747 bln
+16.946 bln
7.41%
jan 1, 2015
264.964 bln
+19.217 bln
7.82%
jan 1, 2016
280.286 bln
+15.323 bln
5.78%
Ranking of countries by current statistics by years


Comments: