29
/
en
AIzaSyAYiBZKx7MnpbEhh9jyipgxe19OcubqV5w
April 1, 2024
170083
Korea, Rep.
KOR
true
2
1
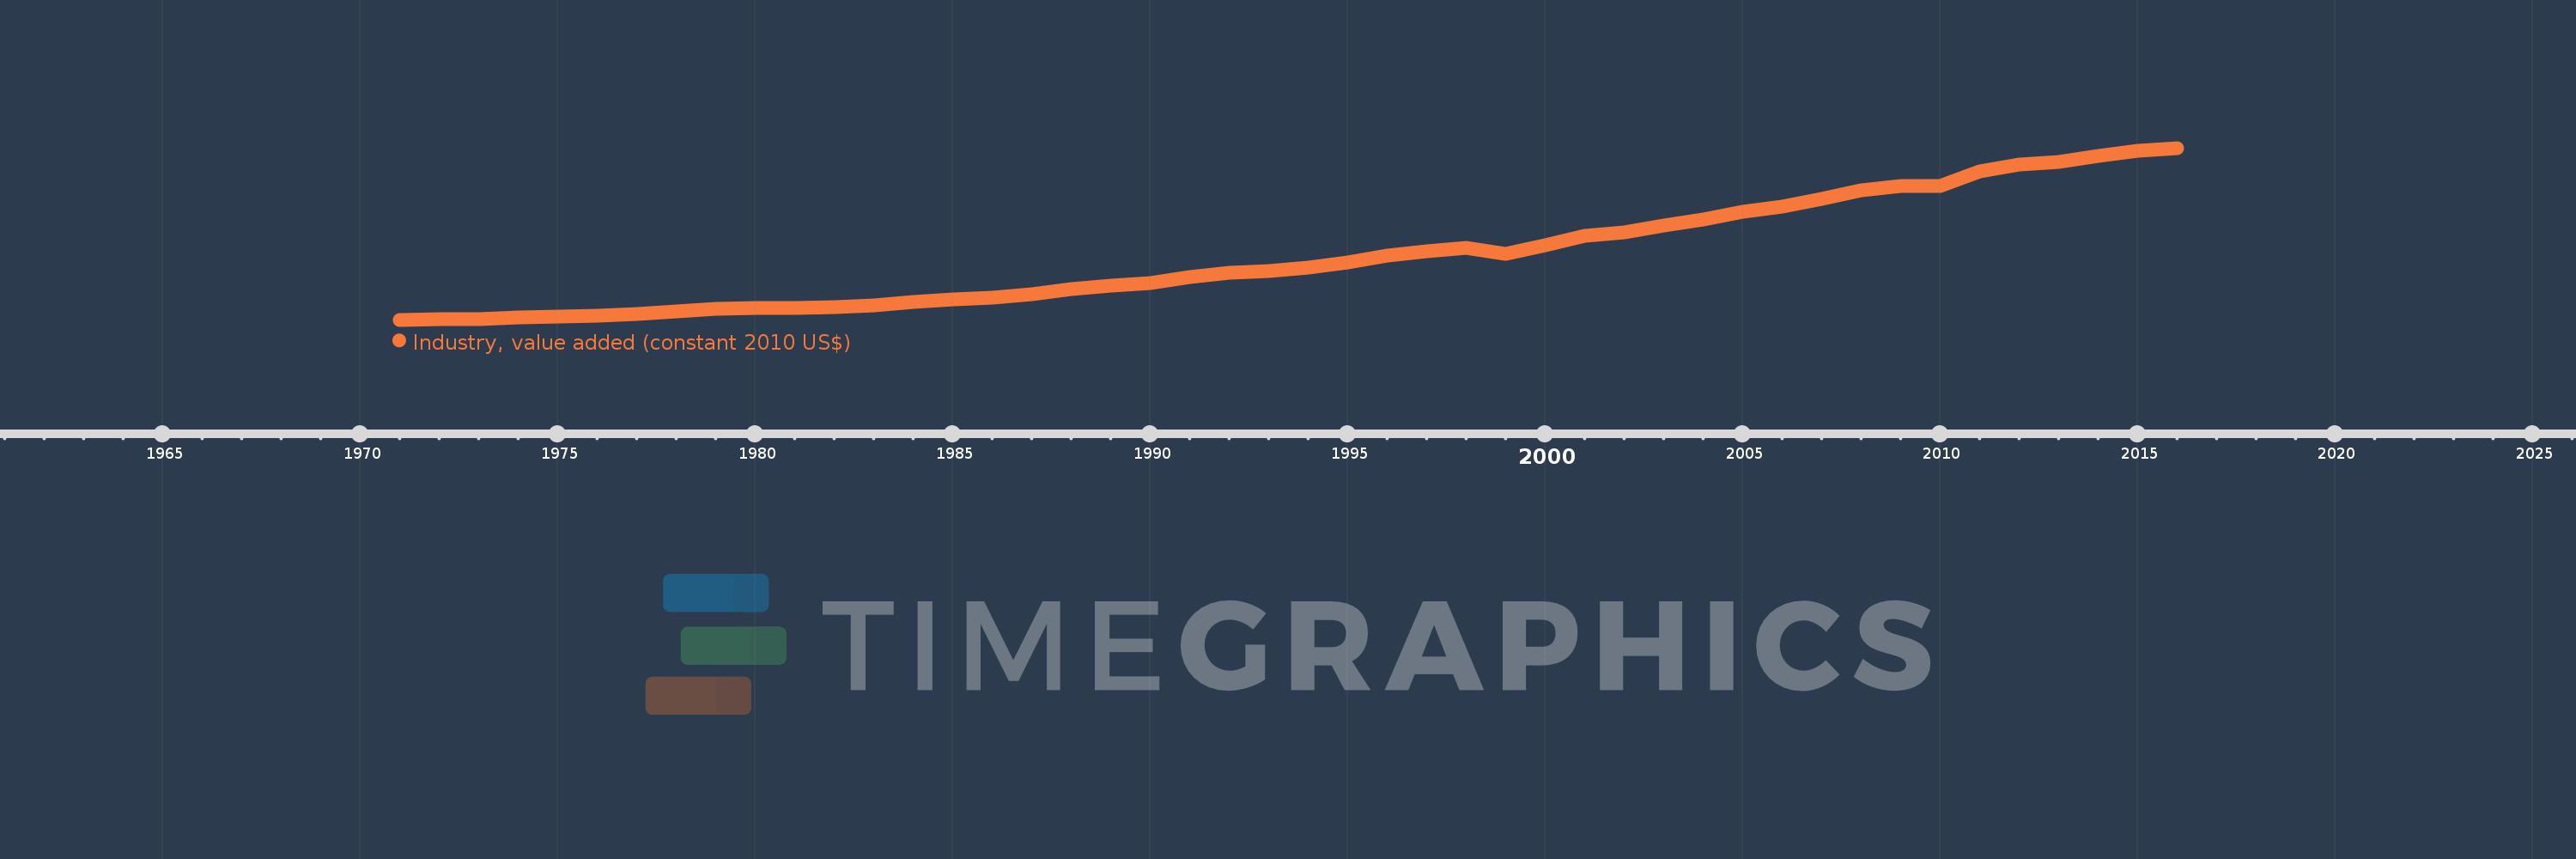
Industry, value added (constant 2010 US$)
2016,2015,2014,2013,2012,2011,2010,2009,2008,2007,2006,2005,2004,2003,2002,2001,2000,1999,1998,1997,1996,1995,1994,1993,1992,1991,1990,1989,1988,1987,1986,1985,1984,1983,1982,1981,1980,1979,1978,1977,1976,1975,1974,1973,1972,1971
This statistics in other country:
AfghanistanAlbaniaAlgeriaAndorraAntigua and BarbudaArab WorldArgentinaArmeniaArubaAustraliaAustriaAzerbaijanBahamas, TheBahrainBangladeshBarbadosBelarusBelgiumBelizeBeninBermudaBhutanBoliviaBosnia and HerzegovinaBotswanaBrazilBrunei DarussalamBulgariaBurkina FasoBurundiCabo VerdeCambodiaCameroonCanadaCaribbean small statesCentral African RepublicCentral Europe and the BalticsChadChileChinaColombiaComorosCongo, Dem. Rep.Congo, Rep.Costa RicaCote d'IvoireCroatiaCubaCyprusCzech RepublicDenmarkDominicaDominican RepublicEarly-demographic dividendEast Asia & PacificEast Asia & Pacific (excluding high income)East Asia & Pacific (IDA & IBRD countries)EcuadorEgypt, Arab Rep.El SalvadorEquatorial GuineaEstoniaEthiopiaEuro areaEurope & Central AsiaEurope & Central Asia (excluding high income)Europe & Central Asia (IDA & IBRD countries)European UnionFijiFinlandFragile and conflict affected situationsFranceGabonGambia, TheGeorgiaGermanyGhanaGreeceGrenadaGuatemalaGuineaGuinea-BissauGuyanaHeavily indebted poor countries (HIPC)High incomeHondurasHong Kong SAR, ChinaHungaryIBRD onlyIcelandIDA & IBRD totalIDA blendIDA onlyIDA totalIndiaIndonesiaIran, Islamic Rep.IraqIrelandItalyJamaicaJapanJordanKazakhstanKenyaKiribatiKorea, Rep.KosovoKuwaitKyrgyz RepublicLao PDRLate-demographic dividendLatin America & Caribbean Latin America & Caribbean (excluding high income)Latin America & the Caribbean (IDA & IBRD countries)LatviaLeast developed countries: UN classificationLebanonLesothoLiberiaLiechtensteinLithuaniaLow & middle incomeLow incomeLower middle incomeLuxembourgMacao SAR, ChinaMacedonia, FYRMadagascarMalawiMalaysiaMaldivesMaliMaltaMarshall IslandsMauritaniaMauritiusMexicoMicronesia, Fed. Sts.Middle East & North AfricaMiddle East & North Africa (excluding high income)Middle East & North Africa (IDA & IBRD countries)Middle incomeMoldovaMongoliaMontenegroMoroccoMozambiqueMyanmarNamibiaNepalNetherlandsNew ZealandNicaraguaNigerNigeriaNorth AmericaNorwayOECD membersOmanOther small statesPacific island small statesPakistanPalauPanamaParaguayPeruPhilippinesPolandPortugalPost-demographic dividendPre-demographic dividendPuerto RicoQatarRomaniaRussian FederationRwandaSamoaSao Tome and PrincipeSaudi ArabiaSenegalSerbiaSeychellesSierra LeoneSingaporeSlovak RepublicSloveniaSmall statesSouth AfricaSouth AsiaSouth Asia (IDA & IBRD)SpainSri LankaSt. Kitts and NevisSt. LuciaSt. Vincent and the GrenadinesSub-Saharan Africa Sub-Saharan Africa (excluding high income)Sub-Saharan Africa (IDA & IBRD countries)SudanSurinameSwazilandSwedenSwitzerlandTajikistanTanzaniaThailandTimor-LesteTogoTongaTrinidad and TobagoTunisiaTurkeyTurkmenistanTuvaluUgandaUkraineUnited Arab EmiratesUnited KingdomUnited StatesUpper middle incomeUruguayUzbekistanVanuatuVenezuela, RBVietnamWest Bank and GazaWorldYemen, Rep.ZambiaZimbabwe Timeline:
This timeline shows a graph from 1971 to 2016 of Korea, Rep.. No data until 1970. Number of actual observations by date: 46.
Source name:
World Development Indicators
Source organization:
World Bank national accounts data, and OECD National Accounts data files.
Categories, topics:
Economy & Growth
Last updated:
apr 23, 2017
Indicators value changes by year
Minimum:
12.517 bln
jan 1, 1971
Maximum:
437.843 bln
jan 1, 2016
At the date of observation
Value
Absolute change
Change from previous value
jan 1, 1971
12.517 bln
+12.517 bln
0.0%
jan 1, 1972
13.449 bln
+931.767 mln
7.44%
jan 1, 1973
14.367 bln
+918.11 mln
6.83%
jan 1, 1974
18.44 bln
+4.073 bln
28.35%
jan 1, 1975
21.005 bln
+2.565 bln
13.91%
jan 1, 1976
23.361 bln
+2.355 bln
11.21%
jan 1, 1977
27.305 bln
+3.945 bln
16.89%
jan 1, 1978
32.357 bln
+5.051 bln
18.5%
jan 1, 1979
39.602 bln
+7.246 bln
22.39%
jan 1, 1980
42.28 bln
+2.678 bln
6.76%
jan 1, 1981
41.683 bln
-597.402 mln
-1.41%
jan 1, 1982
43.637 bln
+1.954 bln
4.69%
jan 1, 1983
47.31 bln
+3.673 bln
8.42%
jan 1, 1984
55.501 bln
+8.191 bln
17.31%
jan 1, 1985
62.622 bln
+7.122 bln
12.83%
jan 1, 1986
66.359 bln
+3.736 bln
5.97%
jan 1, 1987
76.024 bln
+9.665 bln
14.56%
jan 1, 1988
88.232 bln
+12.209 bln
16.06%
jan 1, 1989
97.751 bln
+9.519 bln
10.79%
jan 1, 1990
103.787 bln
+6.036 bln
6.18%
jan 1, 1991
117.679 bln
+13.892 bln
13.39%
jan 1, 1992
129.71 bln
+12.031 bln
10.22%
jan 1, 1993
133.082 bln
+3.372 bln
2.6%
jan 1, 1994
141.855 bln
+8.773 bln
6.59%
jan 1, 1995
155.335 bln
+13.48 bln
9.5%
jan 1, 1996
170.618 bln
+15.282 bln
9.84%
jan 1, 1997
182.983 bln
+12.365 bln
7.25%
jan 1, 1998
191.143 bln
+8.16 bln
4.46%
jan 1, 1999
175.551 bln
-15.592 bln
-8.16%
jan 1, 2000
196.925 bln
+21.375 bln
12.18%
jan 1, 2001
219.988 bln
+23.063 bln
11.71%
jan 1, 2002
228.182 bln
+8.194 bln
3.72%
jan 1, 2003
246.092 bln
+17.91 bln
7.85%
jan 1, 2004
259.67 bln
+13.578 bln
5.52%
jan 1, 2005
280.002 bln
+20.332 bln
7.83%
jan 1, 2006
293.117 bln
+13.115 bln
4.68%
jan 1, 2007
311.482 bln
+18.365 bln
6.27%
jan 1, 2008
333.665 bln
+22.182 bln
7.12%
jan 1, 2009
342.616 bln
+8.952 bln
2.68%
jan 1, 2010
343.401 bln
+784.82 mln
0.23%
jan 1, 2011
379.077 bln
+35.676 bln
10.39%
jan 1, 2012
396.24 bln
+17.163 bln
4.53%
jan 1, 2013
403.953 bln
+7.712 bln
1.95%
jan 1, 2014
417.319 bln
+13.367 bln
3.31%
jan 1, 2015
430.46 bln
+13.141 bln
3.15%
jan 1, 2016
437.843 bln
+7.383 bln
1.72%
Ranking of countries by current statistics by years


Comments: