29
/
en
AIzaSyAYiBZKx7MnpbEhh9jyipgxe19OcubqV5w
April 1, 2024
162707
Jamaica
JAM
true
2
1
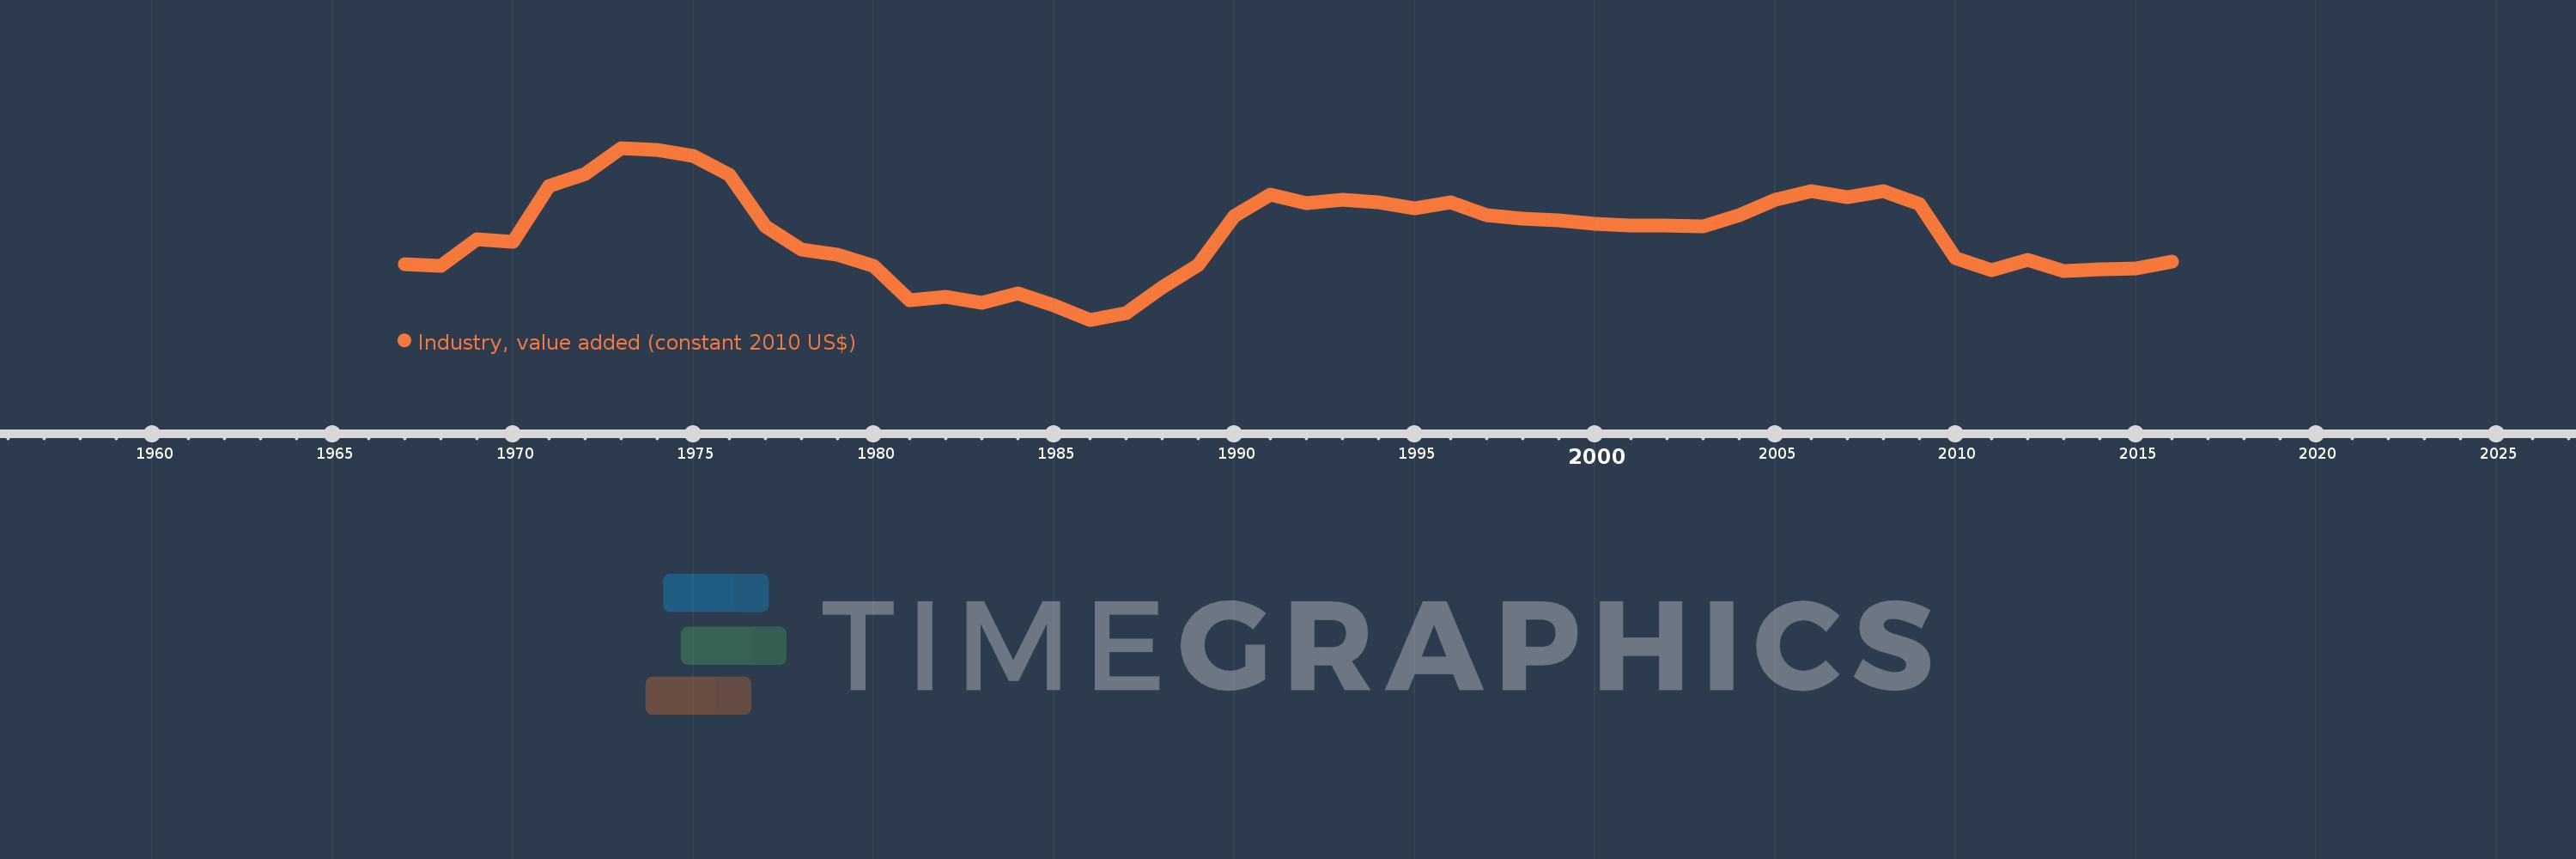
Industry, value added (constant 2010 US$)
2016,2015,2014,2013,2012,2011,2010,2009,2008,2007,2006,2005,2004,2003,2002,2001,2000,1999,1998,1997,1996,1995,1994,1993,1992,1991,1990,1989,1988,1987,1986,1985,1984,1983,1982,1981,1980,1979,1978,1977,1976,1975,1974,1973,1972,1971,1970,1969,1968,1967
This statistics in other country:
AfghanistanAlbaniaAlgeriaAndorraAntigua and BarbudaArab WorldArgentinaArmeniaArubaAustraliaAustriaAzerbaijanBahamas, TheBahrainBangladeshBarbadosBelarusBelgiumBelizeBeninBermudaBhutanBoliviaBosnia and HerzegovinaBotswanaBrazilBrunei DarussalamBulgariaBurkina FasoBurundiCabo VerdeCambodiaCameroonCanadaCaribbean small statesCentral African RepublicCentral Europe and the BalticsChadChileChinaColombiaComorosCongo, Dem. Rep.Congo, Rep.Costa RicaCote d'IvoireCroatiaCubaCyprusCzech RepublicDenmarkDominicaDominican RepublicEarly-demographic dividendEast Asia & PacificEast Asia & Pacific (excluding high income)East Asia & Pacific (IDA & IBRD countries)EcuadorEgypt, Arab Rep.El SalvadorEquatorial GuineaEstoniaEthiopiaEuro areaEurope & Central AsiaEurope & Central Asia (excluding high income)Europe & Central Asia (IDA & IBRD countries)European UnionFijiFinlandFragile and conflict affected situationsFranceGabonGambia, TheGeorgiaGermanyGhanaGreeceGrenadaGuatemalaGuineaGuinea-BissauGuyanaHeavily indebted poor countries (HIPC)High incomeHondurasHong Kong SAR, ChinaHungaryIBRD onlyIcelandIDA & IBRD totalIDA blendIDA onlyIDA totalIndiaIndonesiaIran, Islamic Rep.IraqIrelandItalyJamaicaJapanJordanKazakhstanKenyaKiribatiKorea, Rep.KosovoKuwaitKyrgyz RepublicLao PDRLate-demographic dividendLatin America & Caribbean Latin America & Caribbean (excluding high income)Latin America & the Caribbean (IDA & IBRD countries)LatviaLeast developed countries: UN classificationLebanonLesothoLiberiaLiechtensteinLithuaniaLow & middle incomeLow incomeLower middle incomeLuxembourgMacao SAR, ChinaMacedonia, FYRMadagascarMalawiMalaysiaMaldivesMaliMaltaMarshall IslandsMauritaniaMauritiusMexicoMicronesia, Fed. Sts.Middle East & North AfricaMiddle East & North Africa (excluding high income)Middle East & North Africa (IDA & IBRD countries)Middle incomeMoldovaMongoliaMontenegroMoroccoMozambiqueMyanmarNamibiaNepalNetherlandsNew ZealandNicaraguaNigerNigeriaNorth AmericaNorwayOECD membersOmanOther small statesPacific island small statesPakistanPalauPanamaParaguayPeruPhilippinesPolandPortugalPost-demographic dividendPre-demographic dividendPuerto RicoQatarRomaniaRussian FederationRwandaSamoaSao Tome and PrincipeSaudi ArabiaSenegalSerbiaSeychellesSierra LeoneSingaporeSlovak RepublicSloveniaSmall statesSouth AfricaSouth AsiaSouth Asia (IDA & IBRD)SpainSri LankaSt. Kitts and NevisSt. LuciaSt. Vincent and the GrenadinesSub-Saharan Africa Sub-Saharan Africa (excluding high income)Sub-Saharan Africa (IDA & IBRD countries)SudanSurinameSwazilandSwedenSwitzerlandTajikistanTanzaniaThailandTimor-LesteTogoTongaTrinidad and TobagoTunisiaTurkeyTurkmenistanTuvaluUgandaUkraineUnited Arab EmiratesUnited KingdomUnited StatesUpper middle incomeUruguayUzbekistanVanuatuVenezuela, RBVietnamWest Bank and GazaWorldYemen, Rep.ZambiaZimbabwe Timeline:
This timeline shows a graph from 1967 to 2016 of Jamaica. No data until 1966. Number of actual observations by date: 50.
Source name:
World Development Indicators
Source organization:
World Bank national accounts data, and OECD National Accounts data files.
Categories, topics:
Economy & Growth
Last updated:
apr 23, 2017
Indicators value changes by year
Minimum:
2.039 bln
jan 1, 1986
Maximum:
3.198 bln
jan 1, 1973
At the date of observation
Value
Absolute change
Change from previous value
jan 1, 1967
2.417 bln
+2.417 bln
0.0%
jan 1, 1968
2.402 bln
-14.972 mln
-0.62%
jan 1, 1969
2.58 bln
+178.791 mln
7.44%
jan 1, 1970
2.566 bln
-14.212 mln
-0.55%
jan 1, 1971
2.939 bln
+373.277 mln
14.55%
jan 1, 1972
3.021 bln
+81.359 mln
2.77%
jan 1, 1973
3.198 bln
+177.233 mln
5.87%
jan 1, 1974
3.185 bln
-13.034 mln
-0.41%
jan 1, 1975
3.145 bln
-39.52 mln
-1.24%
jan 1, 1976
3.019 bln
-126.237 mln
-4.01%
jan 1, 1977
2.67 bln
-349.489 mln
-11.58%
jan 1, 1978
2.509 bln
-160.361 mln
-6.01%
jan 1, 1979
2.48 bln
-29.146 mln
-1.16%
jan 1, 1980
2.4 bln
-79.801 mln
-3.22%
jan 1, 1981
2.173 bln
-227.888 mln
-9.49%
jan 1, 1982
2.191 bln
+18.81 mln
0.87%
jan 1, 1983
2.153 bln
-38.38 mln
-1.75%
jan 1, 1984
2.216 bln
+63.309 mln
2.94%
jan 1, 1985
2.136 bln
-80.181 mln
-3.62%
jan 1, 1986
2.039 bln
-97.433 mln
-4.56%
jan 1, 1987
2.085 bln
+46.604 mln
2.29%
jan 1, 1988
2.258 bln
+173.15 mln
8.3%
jan 1, 1989
2.409 bln
+150.551 mln
6.67%
jan 1, 1990
2.736 bln
+326.641 mln
13.56%
jan 1, 1991
2.885 bln
+149.086 mln
5.45%
jan 1, 1992
2.828 bln
-56.583 mln
-1.96%
jan 1, 1993
2.849 bln
+20.49 mln
0.72%
jan 1, 1994
2.831 bln
-17.305 mln
-0.61%
jan 1, 1995
2.793 bln
-38.365 mln
-1.36%
jan 1, 1996
2.829 bln
+36.162 mln
1.29%
jan 1, 1997
2.741 bln
-87.629 mln
-3.1%
jan 1, 1998
2.721 bln
-20.836 mln
-0.76%
jan 1, 1999
2.707 bln
-13.855 mln
-0.51%
jan 1, 2000
2.684 bln
-22.725 mln
-0.84%
jan 1, 2001
2.672 bln
-11.803 mln
-0.44%
jan 1, 2002
2.677 bln
+4.245 mln
0.16%
jan 1, 2003
2.669 bln
-7.793 mln
-0.29%
jan 1, 2004
2.744 bln
+74.97 mln
2.81%
jan 1, 2005
2.849 bln
+104.998 mln
3.83%
jan 1, 2006
2.904 bln
+55.02 mln
1.93%
jan 1, 2007
2.866 bln
-38.105 mln
-1.31%
jan 1, 2008
2.909 bln
+43.144 mln
1.51%
jan 1, 2009
2.817 bln
-91.865 mln
-3.16%
jan 1, 2010
2.453 bln
-364.347 mln
-12.93%
jan 1, 2011
2.372 bln
-80.771 mln
-3.29%
jan 1, 2012
2.44 bln
+68.567 mln
2.89%
jan 1, 2013
2.369 bln
-71.249 mln
-2.92%
jan 1, 2014
2.379 bln
+9.861 mln
0.42%
jan 1, 2015
2.383 bln
+3.575 mln
0.15%
jan 1, 2016
2.433 bln
+50.509 mln
2.12%
Ranking of countries by current statistics by years


Comments: